Vernon Tava’s Sustainable NZ party made a transparent attempt to target the center of the political spectrum. The logic was that they would be an environmentalist movement that wasn’t tarnished by the social justice obsession of the Greens. In the end, they received 1,880 votes, which amounted to less than 0.1% of the total.
Variable
Voting Sustainable NZ in 2020
Voting ACT in 2020
0.54
Voting National in 2020
0.50
Voting Greens in 2020
0.26
Voting New Conservative in 2020
0.37
Voting The Opportunities Party in 2020
0.32
Voting Labour in 2020
0.02
Voting Aotearoa Legalise Cannabis Party in 2020
-0.41
Voting Maori Party in 2020
-0.46
Sustainable NZ may not have won many votes, but they succeeded in positioning themselves somewhere between the National Party and the Green Party. The correlation between voting Sustainable NZ in 2020 and voting National in 2020 was 0.50, and with voting Greens in 2020 it was 0.26. Both are significantly positive.
The correlation between voting Sustainable NZ in 2020 and voting Labour in 2020 was not significant, at 0.02. This suggests that Sustainable NZ was successful in avoiding the label of ‘left-wing’. In fact, there was even a correlation of 0.37 between voting Sustainable NZ in 2020 and voting New Conservative in 2020.
The strongest negative correlations with voting Sustainable NZ in 2020 were with voting for the parties representing disadvantaged demographics, such as the ALCP (-0.41) and the Maori Party (-0.46).
Variable
Voting Sustainable NZ in 2020
< $5,000
-0.17
$5,000-$10,000
-0.11
$10,000-$20,000
-0.37
$20,000-$30,000
-0.18
$30,000-$50,000
-0.32
$50,000-$70,000
0.23
$70,000+
0.44
The general rule is: the wealthier the voter, the more likely they were to vote Sustainable NZ in 2020. The reason for this, as it is for the Greens and The Opportunities Party, is that environmental issues are high up Maslow’s Hierarchy of Needs, and people suffering from housing or income insecurity will vote on the basis of that instead.
The strongest support of any income bracket for Sustainable NZ came from the $70,000+ bracket. The correlation between voting for Sustainable NZ in 2020 and having a personal income of over $70,000 was 0.44. This is a curious result, given that votes for alternative parties are normally cast by disenfranchised people, and disenfranchised people normally vote for left-wing parties. This paradox may explain why Sustainable NZ got so few votes.
The financially disenfranchised avoided voting for Sustainable NZ. The correlation between having an income between $10,000 and $20,000 and voting Sustainable NZ in 2020 was -0.37.
Variable
Voting Sustainable NZ in 2020
No qualifications
-0.46
Level 1 certificate
-0.22
Level 2 certificate
-0.31
Level 3 certificate
-0.24
Level 4 certifiate
-0.30
Level 5 diploma
-0.20
Level 6 diploma
0.55
Bachelor’s degree
0.36
Honours degree
0.40
Master’s degree
0.34
Doctorate
0.34
As with the Greens, ACT and The Opportunities Party, highly educated voters were more likely to vote Sustainable NZ than poorly educated ones. There was a significant positive correlation between voting Sustainable NZ in 2020 and having any of the university degrees. On the other hand, there was a correlation of -0.46 between voting Sustainable NZ in 2020 and having no academic qualifications.
Unlike the Greens, the correlation between voting Sustainable NZ in 2020 and having a highest educational qualification of a level 3 certificate was significantly negative. This reflects the fact that the Greens have broad appeal among university students, a niche that Sustainable NZ were unable to gain entry to.
From these three sets of correlations, we can see that Sustainable NZ voters were considerably more privileged than the average voter.
Variable
Voting Sustainable NZ in 2020
No children
0.19
One child
-0.02
Two children
0.39
Three children
-0.05
Four children
-0.46
Five children
-0.62
Six children
-0.64
Sustainable NZ voters walked the talk when it comes to the sustainability of their breeding. The strongest correlation between voting for Sustainable NZ in 2020 and having any number of children was two (0.39). There was also a positive correlation of 0.19 between voting for Sustainable NZ in 2020 and having no children.
On the other hand, there were significant negative correlations between voting Sustainable NZ in 2020 and having four, five or six children. All three of these correlations were at least as negative as -0.46. Sustainable NZ voters are clearly aware that having more than two children is unsustainable.
Variable
Voting Sustainable NZ in 2020
Working as a manager
0.45
Working as a professional
0.31
Working as a machinery operator or driver
-0.52
Working as a labourer
-0.45
A curious outcome of the election is that there was a significant positive correlation between voting Sustainable NZ in 2020 and both working as a manager and working as a professional. Working as a manager and working as a professional are the archetypal occupations of National and the Greens, respectively.
The working-class occupations, by contrast, were relatively less likely to vote Sustainable NZ in 2020. As mentioned above, people who are worried about housing affordability generally consider environmentalism to be a luxury concern.
In summary, Vernon Tava and his Sustainable NZ movement were successful in positioning themselves in the “blue-green” space that appeals to educated, long-sighted people, whether managers or professionals. The problem is that they failed in the much more important objective of obtaining enough votes to threaten the 5% threshold.
*
This article is an excerpt from the upcoming 3rd Edition of Understanding New Zealand, by Dan McGlashan and published by VJM Publishing. Understanding New Zealand is the comprehensive guide to the demographics and voting patterns of the New Zealand people.
People today work as hard as their parents did, but they have much less wealth. The reason for their relative poverty is that three mighty lions take a share of every worker’s production before it gets to their bank account. These three lions have always existed, but today they are much more ravenous than ever before.
The first lion is profits.
Ultimately, it doesn’t matter how productive the average worker is, because their employer takes all their production off them and gives only a fraction back, in the form of wages. This is inescapable given that the employer owns the workplace and everything that gets produced in it, and given that the Police will always take their side (at least initially) in any property or rights dispute.
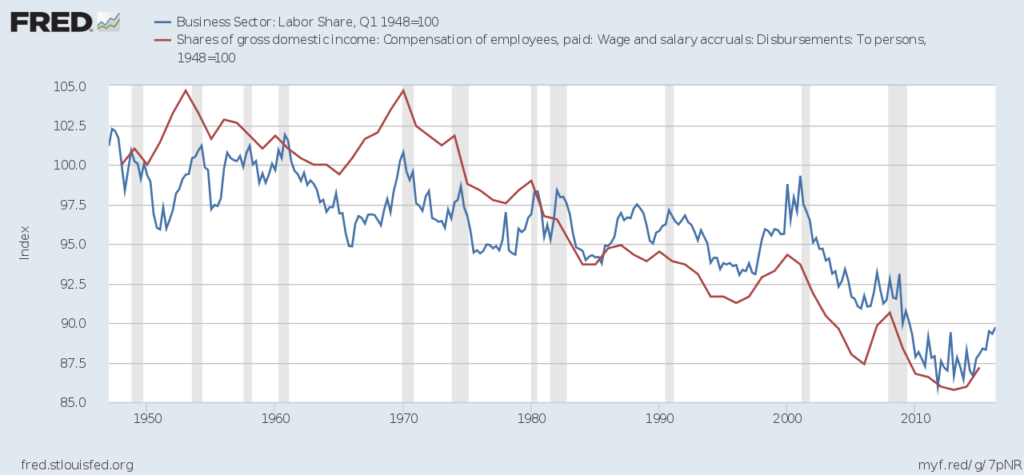
In America, the labour share (or wage share) has been declining for several decades. Compared to the early 1970s, the labour share has declined some 10%. An OECD report suggests that a similar decline, of about 10%, has been seen in the labour share across a basket of Western countries. Employers take more, and give back less, than ever before.
To put this into perspective, the average American worker produces some USD72 of goods and services per hour of labour. A fall in labour share, from 65% to 55%, represents a $7.20 difference by the time it gets to the worker – and that’s before the other two lions take their share!
The second lion is taxes.
The average tax burden in Anglo countries is about 30%. This is lower than the average of other Western nations, and reflects that Anglo countries are run in accordance with a small-government ideology. However, it’s still a significant amount of the average worker’s productivity. After losing 45% of their productivity to profits, to lose a further 30% to taxes is brutal.
It means that our average worker, having produced $72 of goods and services before the lions took their share, is now down to about $27 after profits and taxes have been accounted for. The tax burdens of Taiwan, Hong Kong and Singapore, by contrast, are all less than 15%, despite that their wages and standards of living are similar to those of Anglo countries.
And there’s still the third lion to contend with – perhaps the hungriest of all. This third lion is rents.
The median monthly gross residential rent in the United States is now around $1,100 per month. Median rents in New Zealand are around the same level. Assuming that our average worker works 150 hours a month, dividing their rent by the number of hours worked gives us around $7 an hour. In other words, seven dollars of the income earned for every hour of labour the average worker performs goes to pay the rent.
Subtracting this from the $27 after profits and taxes means that the average American worker ends up with $20 out of every $72 they produce, once profits, taxes and rents have been taken out. If the labour share was still 65%, if the tax rate was 15% like in Far East Asia and if the average rents were at pre-Clown World levels (let’s say $600 per month), the average worker would be left with around $36 for every hour worked – almost twice as much as in reality.
Moreover, out of the $20 per hour the average worker gets in reality, they have to pay for a number of work-related expenses out of that. Transport to and from their job, work clothing, health insurance (if American) and the cost of any psychiatric medicine they might need would account for another $10 at least. They also need to save some of their wage for a house deposit if they aspire to ever be more than a rentcuck.
All of these facts tell us that, if the average Anglo worker in 2021 had the benefit of a pre-1970s labour share, Far East Asian tax levels and pre-Global Financial Crisis rent levels, they would have about three times as much disposable income as they actually do have in reality. Once the three lions have taken their share, there isn’t much left over for the average worker.
In summary, the three lions that take a share out of every worker’s wage, before the worker sees it, are profits, taxes and rents. If we could reduce these expenses to levels that exist elsewhere in space and time, we could triple the prosperity of the average worker.
Like the ACT Party, the Greens have been described as the next generation’s alternative to the Establishment. Also like the ACT Party, the Greens increased their vote from 2017, although the Greens only increased slightly, from 162,443 votes (6.3% of the total) to 226,757 votes (7.9% of the total). This was enough for ten seats in Parliament.
As in previous years, those who voted Greens in 2020 were much better educated than the average New Zealander. This, more than anything else, was the most distinguishing characteristic of the Greens voter.
Variable
Voting Greens in 2020
No qualifications
-0.64
Level 1 certificate
-0.58
Level 2 certificate
-0.53
Level 3 certificate
0.31
Level 4 certificate
-0.60
Level 5 diploma
-0.71
Level 6 diploma
0.05
Bachelor’s degree
0.59
Honours degree
0.77
Master’s degree
0.74
Doctorate
0.77
The correlation between having any one of the three highest university degrees and voting Greens in 2020 was at least 0.74. This is one of the strongest correlations between any demographic variable and voting for a particular party in 2020.
The reason for this is simple, but widely denied. People who can understand scientific literature understand that the human race is on a path to destruction, and that our current lifestyles are not sustainable. As such, they vote for environmentalism. This pattern is replicated in most other Western countries.
On the other hand, the correlation between having no qualifications and voting Greens in 2020 was -0.64. Poorly-educated people often resent the scientific approach taken by the Greens, and don’t consider it particularly intelligent. In general, the more poorly-educated a person is, the more they will resent being told that our current lifestyles are unsustainable.
The Greens are a large enough movement to present different faces to different people. Although some might see Marama Davidson and Golriz Ghahraman, and decide that the Greens are a dangerous pack of Brown Communists, others see Chloe Swarbrick and James Shaw and decide that the Greens are the only party who take science and scientific evidence seriously.
Variable
Voting Greens in 2020
Special voting Yes for euthanasia
0.70
Special voting Yes for cannabis
0.68
This latter point is shown most clearly in the results of the cannabis referendum. There was a very strong positive correlation of 0.68 between casting a special vote for Yes in the cannabis referendum and voting Greens in 2020.
The reason for this is clear: anyone who actually looks at the scientific evidence will understand that cannabis is medicinal and not anywhere near as harmful as its detractors have claimed it to be (two points that VJM Publishing discussed at length in The Case For Cannabis Law Reform). Given this, it seems unreasonably cruel to keep locking people up for using it.
The correlation was even more strongly positive for the euthanasia referendum, which speaks to the absence of religious superstition among Green Party voters. The most common reason for people to vote No in the euthanasia referendum was a superstitious fear of death, and not many Green voters suffer from this.
Variable
Voting Greens in 2020
No religion
0.31
Buddhism
0.22
Christianity
-0.39
Hinduism
0.09
Islam
0.10
Judaism
0.54
Maori religions
-0.30
Spiritualism and New Age religions
0.34
It’s easily possible to overstate how irreligious the Greens are. Although there was a significant negative correlation between voting Greens in 2020 and being either Christian (-0.39) or a follower of a Maori religion (-0.30), these were the only religions to be so negatively correlated.
The strongest positive correlation between voting Green in 2020 and belonging to a religion was with Judaism, at 0.54. Next was Buddhism, at 0.22. For the most part, this follows the rule that, the better educated a voter is, the more likely they are to vote Green.
The one notable exception is people who follow Spiritualism and New Age religions. This group is not particularly well educated, but they like to vote Green nevertheless. The correlation between being a Spiritualist or New Ager and voting Greens in 2020 was 0.34. The explanation is probably because Spiritualists and New Agers share with the Greens many anti-capitalist and anti-consumerist sentiments.
There was a significant positive correlation, of 0.31, between having no religion and voting Greens in 2020. This speaks to the extent to which Greens supporters are members of the scientific and technical elite, which is educated into a scientific materialist paradigm at high school and university.
Variable
Voting Greens in 2020
Living in an urban electorate
0.30
Living on the North Island
-0.08
Percentage of males
-0.16
Surprising to many is the fact that Greens voters in 2020 were significantly more urban than rural. Some might suggest that this shows the Greens to not really care much about environmental issues. A more plausible explanation is that educated people have to move to urban environments to get jobs that make the most of their skills, and so it’s the fact that Green voters are highly educated that explains why they are so urban.
Green voters are slightly more likely to live on the South Island. These correlations reveal that their strongest support is in places like Christchurch, Dunedin and Nelson. Indeed, these are the places where environmentalist and anti-consumerist sentiments are strongest.
Green voters are also slightly more likely to be female, although the correlation between voting Greens in 2020 and percentage of males was also not statistically significant, at -0.16. This suggests that educated young women like Julie Anne Genter and Chloe Swarbrick represent the archetypal Green supporter.
Variable
Voting Greens in 2020
Working as a manager
-0.04
Working as a professional
0.75
Working as a technician or trades worker
-0.50
Working as a community or personal service worker
-0.03
Working as a clerical or administrative worker
0.03
Working as a sales worker
-0.09
Working as a machinery operator or driver
-0.58
Working as a labourer
-0.48
The most striking thing about Greens voters is how heavily represented they are among professionals. The correlation between voting Greens in 2020 and working as a professional was 0.75, one of the strongest between any party and any occupation. This is inevitable given how well-educated Greens voters and professionals both are.
There were significant negative correlations between voting Greens in 2020 and working as a machinery operator or driver (-0.58), as a technician or trades worker (-0.50) or as a labourer (-0.48), three of the most typically working-class occupations.
These correlations might seem strange, given that the Greens are a firmly left-wing party and therefore are supposed to represent the working class. The paradox at the heart of the Greens is that, despite their positioning, few working-class people vote for them.
The reality is that the Greens, like all Parliamentary parties, represent not a specific part of the population but a specific part of the Establishment. The Greens’ turf is the young, well-educated globalists whose parents usually vote National.
Variable
Voting Greens in 2020
European
0.19
Maori
-0.27
Pacific Islander
-0.19
Asian
0.12
Many will also be surprised, given the virtue signalling that the Greens do around Maori issues, that there was a significant negative correlation (-0.27) between voting Greens in 2020 and being Maori. There was also a negative correlation between voting Greens in 2020 and being a Pacific Islander.
On the other hand, there were positive correlations between voting Greens in 2020 and being either a Kiwi of European descent or Asian. Neither of these correlations were significant, but they reflected the general trend that the better-educated any one group of New Zealanders is, the more likely they are to vote for the Green Party.
Variable
Voting Greens in 2020
< $5,000
-0.01
$5,001-$10,000
0.34
$10,001-$20,000
-0.37
$20,001-$30,000
-0.37
$30,001-$50,000
-0.52
$50,001-$70,000
-0.04
$70,000+
0.52
That voting Green is not considered a working-class option is underlined by the fact that there is a negative correlation of -0.52 between voting Greens in 2020 and having an income of $30,001-$50,000. Someone working 2,000 hours a week, or close to it, at or just above minimum wage will be in the middle of this income bracket.
On the other hand, there was a strong positive correlation of 0.52 between voting Greens in 2020 and having an income of $70,000+. Many people in the top 15-20% of income are Greens supporters, which is a function of the fact that Greens supporters tend to be better educated than average and that educated people tend to earn more than average.
Variable
Voting Greens 2020
Aged 20-24
0.56
Aged 25-29
0.45
Aged 30-34
0.34
Aged 35-39
0.24
Aged 40-44
0.21
Aged 45-49
0.08
Aged 50-54
-0.02
Aged 55-59
-0.13
Aged 60-64
-0.17
Aged 65-69
-0.16
Aged 70-74
-0.16
Aged 75-79
-0.17
Aged 80-84
-0.15
Aged 85+
-0.04
Up until pension age, there is a clear trend: the younger someone is, the more likely they are to vote Greens.
The aged 20-24 demographic, or the “student” demographic, are the strongest supporters. The correlation between being in this age bracket and voting Greens in 2020 was 0.56. This contrasts sharply with the correlation between being aged 20-24 and voting Labour in 2020, which was -0.02.
For every age bracket older than this up until pension age, the correlation between being in that bracket and voting Greens in 2020 becomes less positive or more negative. The correlation between being aged 60-64 and voting Greens in 2020 was -0.17, and the correlations for older age brackets were similar.
These numbers support the idea of the four basic political niches, with the Greens representing young women (or the alternative left). It remains to be seen whether Green-voting young women switch to Labour in coming years as they get older.
Variable
Voting Greens 2020
Work in agriculture, forestry and fishing
-0.34
Work in mining
-0.12
Work in manufacturing
-0.69
Work in electricity, gas, water and waste
-0.20
Work in construction
-0.46
Work in wholesale trade
-0.30
Work in retail trade
-0.23
Work in accommodation and food service
0.41
Work in transport, postal and warehousing
-0.41
Work in information media and telecommunications
0.64
Work in financial and insurance services
0.44
Work in rental, hiring and real estate services
0.05
Work in professional, scientific and technical services
0.62
Work in administrative and support services
-0.05
Work in public administration and safety
0.51
Work in education and training
0.29
Work in healthcare and social assistance
0.04
Work in arts and recreation services
0.61
Examining the industries in which Greens supporters work reveals that they are heavily represented in cultural and social jobs as well as intellectual ones.
Given the strength of the correlations between having a university degree and voting Greens in 2020, it’s unsurprising that Greens supporters are heavily represented among those working in professional, scientific and technical services. The correlation between working in such services and voting Greens in 2020 was 0.62.
There was an even stronger correlation between working in information media and telecommunications and voting Greens in 2020 – this was 0.64. As with professional, scientific and technical services, employment in this industry generally requires a good education. The information media and telecommunications industry also attracts many young people, which increases the proportion of Greens voters among them.
The third industry to have heavy Green representation is working in arts and recreation services. This industry is heavily populated with the young and talented and these people tend to vote Green. Women like Eleanor Catton are typical of the kind of high-IQ Green supporter that works in the arts.
Green voters are least likely to work in typical working-class industries, which is again surprising to those who consider the Greens to be a leftist movement. There was a significant negative correlation between voting Greens in 2020 and working in manufacturing (-0.69), working in construction (-0.46), working in transport, postal and warehousing (-0.41) or working in agriculture, forestry and fishing (-0.34).
The significant correlation between voting Greens in 2020 and working in accommodation and food services can be explained by the fact that many Greens voters are students, and students comprise a large proportion of those working in that industry.
Variable
Voting Greens 2020
Voting Greens 2017
Voting Labour same year
0.29
0.11
Voting National same year
-0.16
-0.25
Voting ACT same year
-0.08
0.17
Voting New Zealand First same year
-0.24
-0.48
Voting Maori Party same year
-0.15
-0.06
Voting ALCP same year
-0.23
-0.13
Voting New Conservative/Conservative same year
-0.35
-0.33
Voting The Opportunities Party same year
0.84
0.77
Voting Advance NZ same year
-0.36
n/a
Voting Sustainable NZ same year
0.26
n/a
The Greens might not have that much in common with their fellow leftists in Labour, but there was a significant positive correlation between voting Greens in 2020 and voting Labour in 2020 (0.29). The correlation between voting for these parties was not significant in 2017.
The strongest positive correlation between voting Greens in 2020 and voting for any other party that year was with voting The Opportunities Party in 2020, which was 0.84. Both parties seem to be targeting the same niche, of young urban leftists. The danger for the Greens in 2023 will be that The Opportunities Party wins so many votes that the Greens fall under the 5% threshold.
Some might be surprised to see that the correlation between voting Greens in 2020 and voting National in 2020 (-0.16) is more strongly negative than the correlation between voting Greens in 2020 and voting ACT in 2020 (-0.08). After all, ACT is even further to the right than National is, and the Greens are a far-left party.
This can be explained by the fact that both the Greens and ACT appeal primarily to younger and better-educated people, whereas National (like Labour) appeals more to older and more poorly-educated people. This means that the support base of the Greens and ACT overlap demographically in ways that they do not overlap ideologically.
The strongest negative correlations with voting Greens in 2020 were with voting Advance NZ in 2020 (-0.36) or voting New Conservatives in 2020 (-0.35). The reasons for these are obvious: Advance NZ and New Conservatives are the two parties with the most poorly-educated followers. They both attract old, poorly-educated and religious voters, which is the exact opposite of the Greens.
Variable
Voting Green 2020
Median income
0.37
Mean income
0.49
Unsurprisingly, given the heavy representation of Greens voters in highly-paid occupations and industries, there were significant positive correlations between voting Greens in 2020 and both median income (0.37) and mean income (0.49). These correlations aren’t quite as strong as the correlations between voting Greens in 2020 and having any of the university degrees, because many Greens voters are still too young to have achieved any workplace seniority.
Variable
Voting Greens in 2020
Income from wage or salary
0.44
Income from self-employment or owning own business
0.15
Income from interest, dividends, rent or other investments
0.43
Income from ACC or private work insurance
-0.47
Income from NZ Super or Veteran’s pension
-0.20
Income from Jobseeker Support
-0.27
Income from Sole Parent Support
-0.31
Income from Supported Living Payment
-0.06
Income from Student Allowance
0.54
Unsurprisingly for a party with so much student support, the correlation between between voting Greens in 2020 and receiving an income from the Student Allowance (0.54) was stronger than any correlation between voting Greens in 2020 and receiving income from any other source.
Some, however, might be surprised to learn that there was a significant positive correlation between voting Greens in 2020 and receiving an income from interest, dividends, rents or other investments (0.43). This statistic speaks to the paradox at the heart of the Greens: they are privileged people speaking for the non-privileged.
In summary, the typical Greens voter is young and urban, and is either on a Student Allowance or has earned a postgraduate degree and is earning a full-time salary as a professional in a major urban centre.
*
This article is an excerpt from the upcoming 3rd Edition of Understanding New Zealand, by Dan McGlashan and published by VJM Publishing. Understanding New Zealand is the comprehensive guide to the demographics and voting patterns of the New Zealand people.
The 2020 General Election was a disaster for National. Their vote count collapsed from 1,152,075 (44.4%) to 738,275 (25.6%). This catastrophic result saw National with no chance of negotiating their way into government.
National lost voters in two major directions. Not only did they lose votes to their fellow right-wing party ACT, but they also lost votes across the centre to Labour.
Variable
Voting National 2020
Voting National 2017
Age 20-24
-0.48
-0.35*
Age 25-29
-0.39
-0.35*
Age 30-34
-0.25
0.20**
Age 35-39
-0.04
0.20**
Age 40-44
0.22
0.20**
Age 45-49
0.58
0.20**
Age 50-54
0.69
0.71***
Age 55-59
0.67
0.71***
Age 60-64
0.70
0.71***
Age 65-69
0.67
0.62****
Age 70-74
0.68
0.62****
Age 75-79
0.69
0.62****
Age 80-84
0.66
0.62****
Age 85+
0.63
0.62****
Although National never got many votes from young people (the correlation between voting National in 2017 and being aged 20-29 was significantly negative), they got even fewer in 2020. Young New Zealand voters followed the general trend of drifting away from conservative parties between 2017 and 2020.
One pattern here is very striking: support for National rises as age rises, up until the 50-54 year old age bracket, at which point it levels off. National support increases the most quickly between ages 30-45, because this is the age in which the largest number make the transition from renter to homeowner, and therefore from a victim of the Establishment to a beneficiary of it.
People in the age brackets where homeownership is very high, i.e. those aged 50 or above, are solidly National supporters. The correlation between voting National in 2020 and owning one’s own home in a family trust was 0.81, and with owning or part owning one’s own home outright it was 0.56. The correlation between voting National in 2020 and neither owning one’s home in a family trust nor outright was -0.75.
The reason for this is obvious: National is more interested in taxing labour than capital, so those who own a lot of capital vote National out of self-interest. The New Zealand homeowner can rest assured that the National Party will never impose a capital gains tax nor a land tax. They are very much the representatives of accumulated capital.
The ongoing and worsening housing crisis is probably the foremost reason that National lost many younger voters, but maintained their position among the middle-aged. After all, the more arduous and difficult it is for a young person to get into a house, the more cruisy and luxurious life is for those who own the houses.
Variable
Voting National 2020
Voting National 2017
European
0.53
0.52
Maori
-0.65
-0.74
Pacific Islander
-0.46
-0.39
Asian
0.07
0.16
If National is the party of the Establishment, then they predictably get a lot of votes from white people. In 2020, the correlation between voting National and being of European descent was 0.53. This is strong enough to suggest that the vast majority of National support comes from white people.
Support for National sank noticeably among Pacific Islanders and Asians, however. Asians are almost completely indifferent to National, and Pacific Islanders now dislike National almost as much as Maoris do. It’s possible that National becomes more and more a white person’s party over time.
The Pacific Island voting bloc is an interesting one, because they are torn between voting Labour for economic reasons and voting National for religious reasons. Few appreciate how hotly contested this bloc is. This contention is probably why Labour does not come out in support of cannabis law reform.
Variable
Voting National 2020
Voting National 2017
Loss or Nil Income
-0.45*
-0.51
Personal Income $1-$5,000
-0.45*
-0.58
Personal Income $5,001-$10,000
-0.57
-0.71
Personal Income $10,001-$15,000
-0.29**
-0.48
Personal Income $15,001-$20,000
-0.29**
-0.19
Personal Income $20,001-$25,000
0.07***
-0.16
Personal Income $25,001-$30,000
0.07***
-0.33
Personal Income $30,001-$35,000
-0.15****
-0.36
Personal Income $35,001-$40,000
-0.15****
-0.42
Personal Income $40,001-$50,000
-0.15****
-0.25
Personal Income $50,001-$60,000
0.32*****
-0.01
Personal Income $60,001-$70,000
0.32*****
0.21
Personal Income $70,001-$100,000
0.41******
0.32
Personal Income $100,001-$150,000
0.41******
0.30
Personal Income $150,000+
0.41******
0.30
The National Party isn’t just the party of those holding wealth, it’s also the party of those earning it. There were significant correlations between voting National in 2020 and having a personal income of over $50,000 per year. The correlation between voting National in 2020 and having a personal income of over $70,000 was 0.41.
Beneficiaries and people in that income range are extremely disinclined to vote National. This is because of the perception, earned during the Bolger and Key Governments, that National is cruel towards non-pensioner beneficiaries. The correlation between voting National in 2020 and having a personal income between $10,001 and $20,000 (i.e. in the non-pensioner beneficiary range) was significantly negative, at -0.29.
The correlations between voting National in 2020 and having a personal income in the pensioner range – between $20,001 and $30,000 per year – were positive. This reflects two things: that National are much more generous towards pensioners than towards other beneficiaries, and that pensioners tend to be more conservative than younger voters, who tend to have less to lose from the status quo.
However, the correlations between being wealthy and voting National were not as strong as the correlations between being old and voting National, and the correlation between earning over $70,000 and voting for a party was stronger for the Greens (0.52) than it was for National. This speaks to the degree to which votes for National are often cast for reasons of social conservatism and not just wealth.
Variable
National Vote 2020
National Vote 2017
No religion
0.16
0.02
Buddhism
0.12
0.20
Christianity
0.10
0.33
Hinduism
-0.14
-0.06
Islam
-0.19
-0.10
Judaism
0.17
0.20
Spiritualism and New Age
-0.16
-0.30
On the subject of social conservatism, this has traditionally been where National got a lot of its voters. Christians are generally happy to have homosexuals, prostitutes and cannabis users locked up in prison for moral reasons, and to that end they tend to vote National.
In 2017, the correlation between voting National and being Christian was 0.33. But by 2020 this had fallen to 0.10. Support for National also fell between 2017 and 2020 among Buddhists (0.20 to 0.12), Hindus (-0.06 to -0.14) and Muslims (-0.10 to -0.19). These voters probably didn’t switch because of moral reasons, but because of the poor example National set with their multiple changes of leadership.
Some might be surprised that Jewish support for National is not higher, given that National recently had a Jewish Prime Minister, and that Jews are by far the most economically privileged demographic in New Zealand. The fact is that Jews are so economically privileged that they are more likely to vote ACT than National.
Spiritualists and New Agers tend not to vote National because they see National as the party of materialism and consumerism. The correlation between voting National in 2020 and being a Spiritualist or New Ager was not significant in 2020, while it was significantly negative in 2017.
The positive (if not significant) correlation between voting National in 2020 or 2017 and having no religion might surprise some, given the existing association between National and Christianity.
Variable
Voting National 2020
Voting National 2017
Voting Labour same year
-0.16
-0.94
Voting Greens same year
-0.16
-0.25
Voting ACT same year
0.92
0.61
Voting New Zealand First same year
0.07
0.04
Voting New Conservative same year
0.68
0.45
Voting The Opportunities Party same year
0.11
-0.20
Voting Maori Party same year
-0.71
-0.76
Voting Advance NZ same year
-0.13
n/a
Voting Sustainable NZ same year
0.50
n/a
Voting ALCP same year
-0.60
-0.70
Voting TEA Party same year
0.21
n/a
Voting Heartland NZ same year
0.13
n/a
Voting Social Credit same year
0.19
n/a
Voting NZ Outdoors Party same year
0.20
n/a
Voting ONE Party same year
-0.17
n/a
Voting Vision NZ Party same year
-0.60
n/a
In 2017 National and Labour were heavily polarised, and appealed to very different demographics. The correlation between voting National in 2017 and voting Labour in 2017 was -0.94, suggesting that there was very little overlap between the two voting blocs.
By 2020, the correlation between voting National and voting Labour was -0.16. This was because so many elderly, rich, white, Christian voters switched to Labour that there was no longer any significant difference between the voters of the two parties. National was still older, richer, whiter – but not by anywhere near as much.
So many old, rich, white people abandoned National for ACT in 2020 that the correlation between voting for either party in 2020 was 0.92. In 2017 this correlation was only 0.61.
There were also strong correlations between voting National in 2020 and voting New Conservative in 2020 (0.68) or voting Sustainable NZ in 2020 (0.50).
Significant negative correlations existed between voting National in 2020 and voting Maori Party in 2020 (-0.71), voting Vision NZ in 2020 or voting Aotearoa Legalise Cannabis Party in 2020 (both -0.60). These parties have a young, poor and brown demographic and are therefore different to the National-voting demographic in several major ways.
None of the correlations between voting National in 2020 and voting for the other parties in 2020 were significant, which speaks to the degree that National is a middle-of-the-road party with broad-based appeal. Most demographics can appreciate the basic National Party appeal of an orderly society, and so National will always have some amount of support even among traditionally disadvantaged demographics.
Variable
Voting National 2020
Voting National 2017
Percentage of males
-0.02
0.33
Perhaps most emblematic of National’s failure in 2020 was the collapse in the male vote from 2017.
Conservative parties all around the world can count on a significantly higher level of support among males than females. This is because men, on average, control a significantly higher proportion of both income and wealth. As such, they are inclined against voting for parties that want to tax income and redistribute wealth, i.e. against the social democratic parties.
That there was a negative correlation between being male and voting National in 2020 reflects how incompetent National appeared between 2017 and 2020. In 2017, the correlation between being male and voting National was significantly positive, at 0.33. By 2020 this advantage had been completely lost.
Variable
Voting National 2020
Voting National 2017
No qualifications
-0.22
-0.41
Level 1 certificate
0.04
-0.16
Level 2 certificate
-0.13
-0.22
Level 3 certificate
-0.68
-0.24*
Level 4 certificate
-0.05
-0.24*
Level 5 diploma
0.01
0.75**
Level 6 diploma
0.80
0.75**
Bachelor’s degree
0.16
0.22
Honours degree
0.20
0.16
Master’s degree
0.11
0.16
Doctorate
0.07
0.13
National likes to present itself as the party of the elite, which they are in a limited sense. However, their eliteness is mostly limited to wealth, and not education.
There were no significant positive correlations between voting National in 2020 and having any of the university degrees. The closest was between voting National in 2020 and having an Honours degree, at 0.20.
This finding might surprise those who are used to thinking of National voters as the natural intellectual elites. National voters are the natural ruling class, because they’re the ones that inherit money and connections, and the ruling class are those who inherit money and connections, not the most intelligent.
The best-educated people, in fact, tend to vote ACT (if male) and Greens (if female).
The correlations between having a Bachelor’s, Master’s or doctorate degree and voting National in 2020 all weakened from 2017. To lose these demographics is to lose the true elite, those who are distinguished by their intellectual contribution to the culture. It’s also to lose the most reasonable people in the centre.
Variable
Voting National 2020
Own house in family trust
0.81
Own or part-own house
0.56
Neither ownership nor family trust
-0.75
As some could guess from their opposition to restrictions on landlords, National is very much the landlords’ party. It’s not surprising, then, that there was an extremely strong correlation between owning a house in a family trust and voting National in 2020. 0.81 is one of the strongest of all correlations between any demographic variable and voting National in 2020.
If people owning a house in a family trust can be considered the upper-middle class, those who own or part-own a house outright might be considered the middle-middle class. There was a correlation of 0.56 between being in this category and voting National in 2020. Landowners, then, are the core National Party demographic.
If society can be crudely divided into the owners and the owned, those who have to labour to pay rent are the owned. The difference between being a feudal-era serf and having to work 15-20 hours a week to pay rent is not obvious to the person doing the work. Few people in this category want to maintain the status quo.
As such, those who don’t own property are extremely unlikely to vote National. There was a correlation of -0.75 between neither owning property outright nor in a family trust and voting National in 2020.
Variable
Voting National 2020
Income from wage or salary
-0.47
Income from self-employment or own business
0.74
Income from interest, dividends, rents or other investments
0.71
If National are the party of ownership, it would follow that their supporters tend to make money from owning things. Indeed, the correlation between receiving an income from interest, dividends, rents or other investments and voting National in 2002 was 0.71.
Receiving an income from a wage or salary had a correlation of -0.47 with voting National in 2020. Unfortunately this category was not separated into income from a wage and income from a salary, because this would have given us some very useful information. In any case, it’s clear that those who have to work don’t like to vote National and those who don’t have to work do like to vote National.
Receiving an income from self-employment or one’s own business and voting National in 2020 had a correlation of 0.74. Unfortunately, also, this category was not separated into income from self-employment and income from passively owning a business. Many self-employed are tradesmen and would vote Labour because of working-class sentiments, so those who own their own business must be among the strongest National supporters of all.
Variable
Voting National 2020
Managers
0.78
Professionals
0.09
Technicians and Trades Workers
0.05
Community and Personal Service Workers
-0.61
Clerical and Administrative Workers
-0.01
Sales Workers
-0.18
Machinery Operators and Drivers
-0.43
Labourers
-0.29
That National is the party of those with power, and not so much the party of those with brains, is further underlined by looking at which professions voted for them in 2020.
The occupation with the strongest support for National, by far, were managers. Being a manager had a correlation of 0.78 with voting for National in 2020. If you have people underneath you who you need to manage, National is your party. This is because of previous pro-employer National measures, such as the Employment Contracts Act.
The correlation between being a professional and voting National in 2020 (0.09) was barely strongly than the correlation between being a technician or trades worker and voting National in 2020 (0.05). This demonstrates the degree to which National doesn’t appeal to those running the country, just to those owning it.
Community and personal service workers were the occupation with the strongest negative correlation with voting National in 2020 (-0.61). This is mostly because this is an occupation that requires high levels of empathy, and National has been known for cruelty ever since the welfare reforms of the Third National Government (a.k.a. Ruthanasia).
Traditional working-class occupations were significantly negatively correlated with voting National in 2020. This was true of both labourers (-0.29) and machinery operators and drivers (-0.43). As with other demographics, this can be readily explained by the fact that National prefers to tax income than wealth, which disadvantages those in working-class occupations.
*
This article is an excerpt from the upcoming 3rd Edition of Understanding New Zealand, by Dan McGlashan and published by VJM Publishing. Understanding New Zealand is the comprehensive guide to the demographics and voting patterns of the New Zealand people.