

Understanding New Zealand 3: Who Voted Labour In 2020?

Jacinda Ardern’s Labour Party comprehensively won the 2020 General Election, drawing 50.0% of the party votes (1,443,546), up from 36.9% (956,184) in 2017. This allowed the Sixth Labour Government to continue governing alone, and without needing help from either the Greens or New Zealand First. This shift towards Labour is the main story of the 2020 General Election.

The main reason for it was the large number of white New Zealanders who shifted loyalty from National to Labour between 2017 and 2020.

The fact is that New Zealand is a majority white country (around 70% of New Zealanders are white according to 2018 Census data). So there only have to be small changes in average sentiment among white people to have major electoral effects. Winning back a large number of white voters from National was chiefly how Labour won a Parliamentary majority.

VariableLabour Vote 2020Labour Vote 2017
European0.11-0.65
Maori-0.330.58
Pacific Islander0.230.61
Asian-0.040.01

The numbers show a major change in sentiments towards Labour among white people. In 2017, the correlation between voting Labour that year and being of European descent was -0.65. By 2020, the correlation between voting Labour and being of European descent was 0.11. This is an enormous change, and it’s the primary reason for Labour’s comprehensive win at the 2020 General Election.

What it means is that the average white person, despite their relative wealth, supported the Labour Party in 2020. This wasn’t close to being true in 2017.

In fact, so many white people voted for Labour in 2020 that there was no longer any significant positive correlation between voting Labour that year and being either Maori or a Pacific Islander. Both of these correlations were very strong in 2017, but had faded away by 2020 owing to the fact that the Labour voting demographic was much whiter that year.

VariableLabour Vote 2020Labour Vote 2017
No qualifications0.060.38
Level 1 certificate-0.050.07
Level 2 certificate-0.050.11
Level 3 certificate-0.010.20*
Level 4 certificate-0.020.20*
Level 5 diploma-0.15-0.75**
Level 6 diploma0.06-0.75**
Bachelor’s degree-0.06-0.24
Honours degree0.04-0.22
Master’s degree0.01-0.19
Doctorate0.17-0.17

The people who switched allegiance to Labour in 2020 were often the highly-educated ones who strongly supported National in 2017.

The correlations between voting Labour in 2017 and having any university degree were all negative and either significant or bordering on it. The correlation between voting Labour in 2017 and having a doctorate was -0.17, but by the time of the 2020 General Election, this had flipped to a positive correlation of 0.17. Holders of other degrees also became notably more Labour-friendly, although less drastically than those with doctorates.

Meanwhile, the correlation between voting Labour and having no qualifications weakened, from 0.38 in 2017 to an almost neutral 0.06 in 2020. This underlines the extent to which the new Labour supporters in 2020 were primarily from the middle class.

VariableLabour Vote 2020
20-24 years old-0.02
25-29 years old-0.07
30-34 years old-0.01
35-39 years old0.03
40-44 years old0.06
45-49 years old0.04
50-54 years old0.10
55-59 years old0.18
60-64 years old0.17
65-69 years old0.17
70-74 years old0.20
75-79 years old0.21
80-84 years old0.27
85+ years old0.27

Those who shifted to Labour in 2020 weren’t just educated, they were also old.

In 2017, there was a correlation of -0.70 between being aged 50-64 and voting Labour, and a correlation of -0.61 between being aged 65+ and voting Labour. The reason for this was easy to explain at the time: old people overwhelmingly prefer conservative parties, a general rule across the entire democratic world.

They didn’t in 2020. Although the correlations between being old and voting National in 2020 are much stronger than the correlations between being old and voting Labour, the correlations between being aged 80-84 years old or 85+ years old and voting Labour in 2020 were both significantly positive, an enormous swing from 2017.

Expressed in rough terms, very few old people voted Labour in 2017, but in 2020 about half of them did. This may be because old people were particularly impressed by Jacinda Ardern’s handling of the Covid-19 pandemic, which threatened to kill many of them, or because they’re concerned about the kind of New Zealand that the National Party would create for their descendants.

VariableLabour Vote 2020Labour Vote 2017
Managers-0.42-0.69
Professionals0.10-0.14
Technicians and Trades Workers0.22-0.01
Community and Personal Service Workers0.110.39
Clerical and Administrative Workers0.250.05
Sales Workers0.110.10
Machinery Operators and Drivers0.060.54
Labourers-0.060.24

Commensurate with increased support for Labour among highly-educated people was increased support among high-skill occupations. Although there was a negative correlation of -0.14 between voting Labour in 2017 and working as a professional, by 2020 this had flipped to 0.10. A thaw in sentiments was also observed among managers. The correlation between working as a manager in 2017 and voting Labour was -0.69, but by 2020 it was only -0.42.

Another notable change from 2017 is that there is no longer a significant positive correlation between voting for Labour and working as a machinery operator or driver. This correlation was 0.54 in 2017, but a mere 0.06 by 2020. A similar, but smaller, pattern is observable with labourers and with community and personal service workers.

This shows that Labour expanded from its base to the centre ground between 2017 and 2020. Over these three years, Labour reduced its reliance on traditional working-class occupations, and increased its appeal to high-skill ones.

VariableLabour Vote 2020
Personal income < $5,000-0.14
Personal income $5,000-$10,000-0.06
Personal income $10,000-$20,0000.12
Personal income $20,000-$30,0000.21
Personal income $30,000-$50,0000.14
Personal income $50,000-$70,0000.02
Personal income > $70,000-0.14

Labour also reduced its traditional reliance on poor voters.

In 2017, the correlation between voting Labour and having an income between $5,000 and $10,000 was 0.58. This is strong enough to show that Labour got many of their votes from there. By 2020, the correlation between being in this income bracket and voting Labour had become negative. This was because Labour shifted from the party of the poor to the party of the everyman.

In 2017, the correlation between voting Labour and being in any income bracket above $60,000 was significantly negative. However, in 2020, the correlation between earning over $70,000 and voting Labour was negative, but not significant. Much of this could be explained by wealthy people starting to feel that Labour had no real appetite for raising taxes.

Indeed, the correlation between voting Labour and median personal income became much less strongly negative between 2017, when it was -0.52, and 2020, when it was -0.27. So although wealthy people still avoid Labour, they do so much less eagerly than they did in 2017.

VariableLabour Vote 2020Labour Vote 2017
Agriculture, Forestry and Fishing-0.23-0.27
Mining-0.03-0.04
Manufacturing-0.050.23
Electricity, Gas, Water and Waste Services0.100.08
Construction-0.03-0.00
Wholesale Trade-0.19-0.15
Retail Trade0.23-0.03
Accommodation and Food Services/Hospitality-0.100.08
Transport, Postal and Warehousing-0.010.54
Information Media and Telecommunications0.070.10
Financial and Insurance Services-0.04-0.08
Rental, Hiring and Real Estate Services-0.36-0.58
Professional, Scientific and Technical Services-0.05-0.20
Administrative and Support Services0.010.37
Public Administration and Safety0.360.20
Education and Training0.120.15
Healthcare and Social Assistance0.440.14
Arts and Recreation Services-0.160.02

Labour’s resurgence might have been pronounced along lines of race, age, education, and occupational skill level, but it was not particularly pronounced along any industry lines.

Generally speaking, the demographic of Labour Party voters became a lot closer to the demographic of everyday New Zealanders between 2017 and 2020. This was apparent from the fact that most correlations between voting Labour and working in a particular industry became weaker as Labour expanded from its working-class base.

Most striking was the correlation between voting Labour and working in transport, postal and warehousing, which crashed from 0.54 in 2017 to -0.01 in 2020. Other industries went in the opposite direction. The correlation between voting Labour and working in rental, hiring and real estate services went from -0.58 in 2017 to -0.38 in 2020.

Wholesale trade, retail trade, manufacturing, public administration and safety, professional and technical services, and agriculture, forestry and fishing all moved towards no correlation with voting Labour from 2017 to 2020. This reflects the broad-based increase in appeal achieved by Labour over the past three years.

One notable exception was the correlation between working in healthcare and social assistance and voting Labour. In 2017 this was not significant, at 0.14. By 2020 it had leapt up to 0.44, and was the strongest correlation between working in any industry and voting Labour. It may be that this workers in this industry, more than any other, anticipate a lot of help from the Sixth Labour Government in its second term.

VariableLabour Vote 2020
No Source of Income-0.18
Wage or Salary0.02
Self-employed or Own Own Business-0.26
Interest, Dividends, Rent, Other Investments0.03
ACC or Private Work Insurance-0.09
NZ Super or Veteran’s Pension0.22
Jobseeker Support-0.09
Sole Parent Support-0.16
Supported Living Payment0.28
Student Allowance0.08

Labour also drastically reduced their reliance on unemployment and invalid’s beneficiaries. In 2017, the correlation between being on the unemployment benefit and voting Labour was 0.73 – by 2020 it was -0.09. This is partly because a great many non-unemployment beneficiaries switched to Labour, but it’s also because of strong support among unemployment beneficiaries for the New Zealand First, Maori, Aotearoa Legalise Cannabis, ONE, Vision NZ and Advance NZ parties.

The correlation between being on the invalid’s benefit and voting Labour in 2020 was significantly positive, at 0.28. This was much weaker than in 2017, when it was 0.58. As with the unemployment benefit, this reflects how Labour broadened their appeal beyond beneficiaries.

Perhaps the most striking change involved pensioners. There was a correlation of -0.51 between being on a pension and voting Labour in 2017. By 2020, this had flipped to a positive correlation of 0.22. The fact that Labour did much better among old people in 2020 has been discussed above. Along with the coronavirus response, the introduction and then doubling of a winter energy payment to pensioners no doubt helped Labour here.

There was still a significant negative correlation between being self-employed or owning one’s own business and voting Labour, but at -0.26 this was much weaker than most people would have guessed. The correlation between being self-employed and voting Labour in 2017 was -0.77.

VariableLabour Vote 2020
National Vote 2020-0.16
Greens Vote 20200.29
ACT Vote 2020-0.12
New Zealand First Vote 20200.06
New Conservative Vote 20200.13
The Opportunity Party Vote 20200.33
Maori Party Vote 2020-0.37
Advance NZ Vote 2020-0.19
Sustainable NZ Vote 20200.02
ALCP Vote 2020-0.27
TEA Party Vote 2020-0.21
Heartland NZ Vote 2020-0.17
Social Credit Vote 20200.25
NZ Outdoors Party Vote 20200.01
ONE Party Vote 20200.25
Vision NZ Party Vote 2020-0.23

That the average Labour voter is much whiter and better-educated in 2020 than in 2017 can be seen from the change in correlations between voting for Labour and voting for other parties.

For one thing, there were significant positive correlations between voting Labour in 2020 and either voting Greens in 2020 (0.29) or voting for The Opportunities Party in 2020 (0.33). These are much stronger than the correlations between voting Labour in 2017 and either voting Greens in 2017 (0.14) or voting for TOP in 2017 (0.00). Greens and TOP voters are disproportionately white and well-educated, two groups that heavily switched to Labour in 2020.

For another thing, there are now significant negative correlations between voting Labour in 2020 and voting for most of the Maori-heavy parties. Although Labour won a great number of votes from old white people, they lost a smaller number of Maori voters to fringe parties. Losing such marginal voters to fringe parties is the inevitable blowback from Ardern’s drive to the centre.

A further noticable change is the correlation between voting Labour in 2017 and voting National in 2017 (-0.94) and the correlation between voting Labour in 2020 and voting National in 2020 (-0.16).

This is a profound difference, and tells the story of a major shift in the demographics of the average Labour voter. In 2017, Labour and National were sharply opposed along lines of wealth, ethnicity, age and education. By 2020, most of those distinctions were eroded. National was still the party for rich old people, but Labour had transformed from the party of the disenfranchised, the brown and the working-class to the party of the average Kiwi.

VariableLabour Vote 2020Labour Vote 2017
Percentage of males-0.15-0.33
Urban electorate0.170.11
Percentage NZ-born-0.050.22
South Island electorate0.23-0.05
Turnout Rate 20200.28n/a
Turnout Rate 2017n/a-0.72

The Labour Party won a lot of male voters from National over the three years before the 2020 General Election. The correlation between voting Labour in 2017 and being male was -0.33. By 2020, this had fallen to -0.15. This suggests that Labour did well in 2020 not only because they demonstrated compassion since 2017 but also because they demonstrated competency.

Labour voters also became much less New Zealand-born between 2017 and 2020. This is mostly because there was not a disproportionate number of Maori voters this time. Immigrants to New Zealand tend to be wealthier than the New Zealand-born, so if Labour wins more middle-class voters they will also win proportionately more immigrants.

Some conspiracy theorists suggested that the 2020 General Election may have been rigged by Labour, the proof being Labour dominance in the rural South Island electorates. But rural South Island voters overlap heavily with the elderly, middle-class voters who switched overwhelmingly to Labour in 2020. In 2020 Labour won a significantly greater proportion of votes from South Island voters than from North Island ones, unlike in 2017.

One of the most striking changes between the 2017 General Election and the 2020 edition were the correlations between voting Labour and turnout rate. In 2017, the correlation between turnout rate and voting Labour was -0.72, which is extremely strong and evidence that Labour voters that year were mostly heavily disenfranchised people. By 2020, the correlation between turnout rate and voting Labour was 0.28, showing that Labour had won the centre between 2017 and 2020.

In summary, Labour won the 2020 General Election by broadening their appeal to the average New Zealander. Increased support for Labour from 2017 was especially noticeable among rich people, white people, old people and the well-educated, all of who are traditionally antipathetic to social democratic parties.

*

This article is an excerpt from the upcoming 3rd Edition of Understanding New Zealand, by Dan McGlashan and published by VJM Publishing. Understanding New Zealand is the comprehensive guide to the demographics and voting patterns of the New Zealand people.

*

If you enjoyed reading this essay, you can get a compilation of the Best VJMP Essays and Articles of 2019 from Amazon for Kindle or Amazon for CreateSpace (for international readers), or TradeMe (for Kiwis). A compilation of the Best VJMP Essays and Articles of 2018 and the Best VJMP Essays and Articles of 2017 are also available.

*

If you would like to support our work in other ways, please consider subscribing to our SubscribeStar fund. Even better, buy any one of our books!

Understanding New Zealand 3: Cannabis Referendum Voters

Calculating the correlations between demographic variables and referendum choice was made difficult by the Electoral Commission’s decision to put the ballots from different electorates into the same box on Election Day. At every polling booth, the referendum ballots for both General and Maori Electorates were put in the same box, and as such we can’t accurately account for how many people in each electorate voted in favour.

The special referendum votes were broken down by electorate, but the total number of such votes was less than 20% of the number of ordinary referendum votes, and so they are not particularly representative of the New Zealand population as a whole. They also don’t overcome the problem that the Maori population is split between the General Roll and the Maori Roll, and so no meaningful correlations between referendum choice and ethnicity can be calculated.

Despite these limitations, we can see the data accurately enough to notice some clear patterns. Five significant trends are apparent.

In short, the major opposition to cannabis law reform in New Zealand is the same people who oppose it everywhere else: old, poorly-educated, religious, antisocial conservatives, i.e. those who fall for fear-based propaganda the hardest and who act to harm other people the most readily.

VariableVoting Yes in cannabis referendumSpecial voting Yes in cannabis referendum
Aged 20-240.510.66
Aged 25-290.460.62
Aged 30-340.330.44
Aged 35-390.090.18
Aged 40-440.02-0.02
Aged 45-49-0.17-0.24
Aged 50-54-0.23-0.40
Aged 55-59-0.16-0.52
Aged 60-64-0.21-0.57
Aged 65-69-0.18-0.53
Aged 70-74-0.19-0.52
Aged 75-79-0.24-0.56
Aged 80-84-0.24-0.58
Aged 85+-0.16-0.50

All of the age groups 34 years old or younger were significantly positively correlated with a will to reform the cannabis laws. This was true both for the ordinary referendum votes and the special ones. The correlation between being aged 20-24 and casting a special vote for Yes in the cannabis referendum was 0.66. Many of these voters would have been young people who enrolled to vote on Election Day.

All of the age groups 45 years old or above were negatively correlated with a will to reform the cannabis laws. As above, this was true both for the ordinary referendum votes and the special ones, although the correlations were only significant in the case of special votes. With the special votes, every age group 45 years old or above was significantly negatively correlated with voting Yes in the cannabis referendum.

Most strikingly, all of the age groups 55 years old or older had negative correlations stronger than -0.50 with casting a special vote for Yes in the cannabis referendum.

The pattern is unmistakable, and easy to explain. Old people who have been brainwashed for decades with Reefer Madness-style anti-cannabis propaganda are generally against it. Young people who have real-world experience with cannabis and who have observed its effects in their friends and/or parents are generally in favour of it.

VariableVoting Yes in cannabis referendumSpecial voting Yes in cannabis referendum
No NZQA qualifications-0.36-0.45
Level 1 certificate-0.33-0.46
Level 2 certificate-0.31-0.33
Level 3 certificate0.410.54
Level 4 certificate-0.30-0.42
Level 5 diploma-0.50-0.46
Level 6 diploma-0.22-0.35
Bachelor’s degree0.340.44
Honours degree0.530.48
Master’s degree0.480.53
Doctorate0.560.45

Another trend is immediately apparent when we look at the correlations between voting Yes in the cannabis referendum and maximum educational achievement. The better educated a person is, the more likely they are to support cannabis law reform.

Belonging to any one of three most poorly-educated groups of people in the country was significantly negatively correlated with voting Yes in the cannabis referendum. By contrast, having any university degree was significantly positively correlated with voting Yes. The strongest correlation was between doctorate degree holders and casting an ordinary vote for Yes – this was 0.56.

The one anomaly in the data – the significant positive correlation between having level 3 NZQA as a highest qualification and voting Yes in the cannabis referendum – can be easily explained. These people are mostly intelligent young people who are at university but are yet to get a degree. So they’re mostly intelligent enough to understand the science of cannabis, but not old enough to have a degree yet.

The reason for the strong correlation between education and pro-cannabis sentiments is fairly obvious. Understanding the effects of cannabis is essentially a scientific enterprise. Those educated enough to understand science understand that cannabis is medicinal. Those not educated enough to understand science have to rely on what they’re told, which is usually by people not educated enough to understand the science.

Education is, at the end of the day, little more than a mental toolbox for determining truth from bullshit. An educated person will be equipped to appraise data and to decide for themselves what is true and what isn’t.

Those unequipped to make such determinations are forced to rely on dictates from authority figures, such as the television or the local priest. Doing so is extremely inaccurate, and is often completely misleading. Those who put themselves forwards as authority figures, and those who are presented as authority figures by the media, are often people with a vested interest in telling lies.

Unfortunately, the cannabis referendum was a national IQ test, and we failed it.

VariableVoting Yes in cannabis referendumSpecial voting Yes in cannabis referendum
Following no religion0.390.22
Following Buddhism-0.050.14
Following Christianity-0.53-0.48
Following Hinduism-0.060.11
Following Islam-0.060.09
Following Judaism0.330.44
Following a Maori religion-0.020.20
Following Spiritualism or New Age religion0.580.25

Many people fail to appreciate the extent to which hating cannabis users is a religious, particularly an Abrahamic, attitude. It was largely Christians who enforced cannabis prohibition in the first place, and it’s largely Christians who argue to continue enforcing it. As such, a significant majority of people who voted No in the cannabis referendum were Christian.

The truth is that cannabis is a spiritual sacrament, and has been used as such for thousands of years. Throughout all time and space, Christians have always sought to destroy all other religious and spiritual traditions, and they have destroyed spiritual practices based around cannabis use in the same way they destroyed spiritual practices based around psilocybin mushroom use.

Christians can’t burn spiritual freethinkers at the stake anymore, but they can still vote for them to be persecuted. And they do, in great numbers. The fact that Christianity is an ideology of hatred is seldom more evident than in the strong negative correlations between being Christian and voting Yes in the cannabis referendum. A correlation of -0.53 between being Christian and casting an ordinary vote for Yes in the cannabis referendum lays bare what many already knew: Christians hate cannabis users.

Buddhists, Hindus and Muslims were generally indifferent to the question of cannabis law reform. This reflects the fact that there are two opposing forces at play in these cultures: the conservative, control-based mentality and the liberal, experience-based mentality. Many voters in these groups, being relatively recent immigrants, are caught between two worlds, unsure of what to accept and what to reject.

Spiritualists and New Agers were the big losers from the referendum result. New Age religion is very fond of cannabis on account of that it facilitates meditation. Spiritualists also like cannabis for the same reason that Rastafarians do: they believe that it enables them to reconnect with God. This explains the strong positive correlation of 0.58 between following Spiritualism or New Age religions and casting an ordinary vote for Yes in the cannabis referendum.

The significant positive correlations between being Jewish and voting Yes in the cannabis referendum are no doubt because of the higher educational attainment of Jews, i.e. most of them voted Yes because they understand the science behind cannabis.

VariableVoting Yes in cannabis referendumSpecial voting Yes in cannabis referendum
Working as manager-0.20-0.20
Working as professional0.510.52
Working as technican or trades worker-0.33-0.48
Working as community or personal service worker0.350.22
Working as clerical or administrative worker-0.200.02
Working as sales worker-0.200.03
Working as machinery operator or driver-0.42-0.28
Working as labourer-0.20-0.31

The fourth apparent trend in the data is that occupations and industries with a lot of human contact tended to vote Yes in the cannabis referendum, while occupations and industries without much human contact tended to vote No.

This mostly reflects differences in empathy. People in social occupations tend to be more open, more closely attuned to other people’s suffering and more sympathetic towards the measures those people take to reduce it. They are also much more likely to support recreational drug use in general, and much less likely to support government measures to interfere in other people’s lives.

There were significant positive correlations between voting Yes in the cannabis referendum and being a professional (0.51) or being a community and personal service worker (0.35). This reflects the fact that people in these occupations are intelligent and empathetic. In the case of professionals, it also reflects a superior reasoning ability.

There were significant negative correlations between voting Yes in the cannabis referendum and being a machinery operator or driver (-0.42) or being a technician or trades worker (-0.33). This might reveal a working-class social conservatism, but more likely follows from the fact that these occupations cannot be performed safely while stoned, and so people in them are concerned about the person next to them being under the influence of cannabis while working.

VariableVoting Yes in cannabis referendumSpecial voting Yes in cannabis referendum
Working in agriculture, forestry or fishing-0.16-0.40
Working in mining0.00-0.16
Working in manufacturing-0.58-0.52
Working in electricity, gas, water and waste services-0.12-0.10
Working in construction-0.38-0.22
Working in wholesale trade-0.56-0.17
Working in retail trade-0.25-0.35
Working in accommodation or food services0.470.40
Working in transport, postal or warehousing-0.42-0.06
Working in information media or telecommunications0.470.57
Working in financial or insurance services0.190.37
Working in rental, hiring or real estate services-0.190.10
Working in professional, scientific or technical services0.370.51
Working in administrative or support services0.050.33
Working in public administration or safety0.460.33
Working in education or training0.290.19
Working in healthcare or social assistance0.18-0.13
Working in arts or recreation services0.600.58

These correlations, between choice of unsocial occupations and voting No in the cannabis referendum, were replicated with choice of industry.

People in social industries heavily supported cannabis law reform, and this was also true of people in creative industries.

There was a significant positive correlation between casting an ordinary vote for Yes in the cannabis referendum and working in Arts and Recreation Services (0.60), Accommodation and Food Services (0.47), Information Media and Telecommunications (0.47), Public Administration and Safety (0.46), Professional, Scientific and Technical Services (0.37) or Education and Training (0.29).

People in industries that are (generally speaking) neither social nor creative heavily opposed cannabis law reform.

There were significant negative correlations between casting an ordinary vote for Yes in the cannabis referendum and working in Manufacturing (-0.58), Wholesale Trade (-0.56), Transport, Postal and Warehousing (-0.42), Construction (-0.38) or Retail Trade (-0.25).

The major distinction here is not obvious, but it is striking, and perhaps summarises the entire cannabis law reform debate: voters working in industries that are focused on people supported cannabis law reform, while voters working in industries that are focused on things generally opposed cannabis law reform.

VariableVoting Yes in cannabis referendumSpecial voting Yes in cannabis referendum
Voting Labour 20200.36-0.11
Voting National 2020-0.50-0.49
Voting Greens 20200.850.68
Voting ACT 2020-0.25-0.43
Voting New Zealand First 20200.03-0.21
Voting New Conservative 2020-0.46-0.66
Voting The Opportunities Party 20200.740.42
Voting Maori Party 20200.340.39
Voting Advance NZ 2020-0.06-0.06
Voting Sustainable NZ 20200.120.05
Voting ALCP 20200.080.23
Voting TEA Party 2020-0.36-0.08
Voting Heartland NZ 2020-0.10-0.09
Voting Social Credit 20200.14-0.30
Voting NZ Outdoors Party 2020-0.04-0.26
Voting ONE Party 20200.05-0.14
Voting Vision NZ Party 2020-0.170.26

The fifth apparent trend in the data involves the strong positive correlations between voting for progressive parties and voting Yes in the cannabis referendum, and the strong negative correlations between voting for conservative parties and voting Yes.

Unsurprisingly, voting for any of the parties that campaigned specifically for cannabis law reform had the strongest correlations with voting Yes on the cannabis referendum. Casting an ordinary vote for Yes in the cannabis referendum had a correlation of 0.85 with voting for the Greens in 2020, and 0.74 with voting for The Opportunities Party in 2020. The correlations with casting a special vote for Yes and voting for these parties were only slightly weaker.

Cannabis law reform supporters will be invigorated by the fact that the correlation between voting Labour in 2020 and casting an ordinary vote for Yes in the cannabis referendum was significantly positive, at 0.36. This suggests that a significant majority of Labour supporters want legal cannabis and so Labour, if they take the will of those supporters into account, should change the law.

National and the New Conservative Party, who explicitly campaigned against cannabis law reform, had the least cannabis-friendly voters. The correlation between voting Yes in the cannabis referendum and voting National in 2020 was -0.50, and with voting New Conservative in 2020 it was -0.46. To a large extent, this reflects the fact that those voters are old, and in the case of New Conservative voters it also reflects a lack of education.

Many will be surprised by the significant negative correlations between voting ACT in 2020 and voting Yes in the cannabis referendum. David Seymour wrote about his support for cannabis law reform in Own Your Future, and openly stated before the referendum that he was voting Yes. ACT is also associated with libertarian urban types who are generally favourable towards drug use of all kinds. So understanding why their voters oppose cannabis law reform is not straightforward.

The reason is that many of the people who voted ACT in 2020 voted National in 2017, and are still conservatives at heart. They voted ACT in 2020 mostly to protest the National Party leadership of the time, and are not really libertarians. This is supported by the fact that ACT voters were much, much older in 2020 than they were in 2017.

The weak correlations between voting for the Aotearoa Legalise Cannabis Party and voting Yes in the cannabis referendum will also surprise many.

First it has to be understood here that ALCP voters are very few in number, and represent the top 1% most fanatical about cannabis in the entire country. Second, many of these cannabis fanatics were unhappy with the Cannabis Legalisation and Control Bill because they either felt that it didn’t go far enough, or because they didn’t want the cannabis industry to become commercialised. So many of them cast No votes despite supporting cannabis law reform in general.

Their reasons might sound paradoxical, but nothing about the cannabis debate has been rational from the beginning.

*

This article is an excerpt from the upcoming 3rd Edition of Understanding New Zealand, by Dan McGlashan and published by VJM Publishing. Understanding New Zealand is the comprehensive guide to the demographics and voting patterns of the New Zealand people.

*

If you enjoyed reading this essay, you can get a compilation of the Best VJMP Essays and Articles of 2019 from Amazon for Kindle or Amazon for CreateSpace (for international readers), or TradeMe (for Kiwis). A compilation of the Best VJMP Essays and Articles of 2018 and the Best VJMP Essays and Articles of 2017 are also available.

*

If you would like to support our work in other ways, please consider subscribing to our SubscribeStar fund. Even better, buy any one of our books!
Ten Reasons Why The Sixth Labour Government Should Legalise Cannabis Despite The Referendum Result

New Zealand cannabis users were gutted yesterday by news that the cannabis referendum had failed. New Zealand’s reputation as a place for intelligent, compassionate decision-making was shattered by the result, which revealed the presence of a virulent strain of religious bigotry. Despite the outcome, there are at least ten good reasons why the Sixth Labour Government should legalise cannabis anyway.

The first reason is that the referendum result showed that the sentiments of the New Zealand people are moving rapidly in favour of cannabis law reform.

It was not long ago that an overwhelming majority of New Zealanders opposed cannabis law reform. When I began campaigning for it in 2007, I often got spoken to like I was the enemy of society. If 46.1% of voters support it now, this means that the trend is moving rapidly in favour of reform, as it is elsewhere in the world. Legalising cannabis now would simply recognise this trend.

The second reason is that the true will of the New Zealand people was confounded by Jacinda Ardern’s cowardice.

National Party Leader Judith Collins was forthright with her position against cannabis law reform. Ardern, who was perhaps worried about losing support from brown religious voters, didn’t state her affirmative position on the referendum until afterwards. If Ardern had not been so gutless, and had stated her position like Collins did, that may have been worth 4-5% (given Ardern’s current level of popularity).

The third reason is that a majority of Labour’s constituents voted in favour of the bill.

As Dan McGlashan showed in Understanding New Zealand, most of Labour’s voters are young people and Maoris. This is also true of supporters of the Aotearoa Legalise Cannabis Party. Although the final statistics are not in yet, it’s already clear that the young and Maori voters who gave Labour their majority also voted in favour of cannabis law reform. Legalising cannabis would accord with Labour’s duty to do right by their supporters.

The fourth reason is that a majority of actual Kiwis voted in favour of the bill.

For whatever reason, you don’t have to be an actual Kiwi to vote in a New Zealand election. Being little more than a fishing village of cheap whores, we’re happy to let permanent residents vote. The problem here is that these newcomers don’t understand New Zealand culture or values. So a majority of them voted in favour of more prohibition.

As with the above point, precise statistics are not available until the final results are in. But McGlashan has predicted, from the strong correlation between voting for the Aotearoa Legalise Cannabis Party in 2017 and being born in New Zealand (0.73), that an absolute majority of New Zealand-born voters will have voted in favour of cannabis law reform.

The fifth reason is that most No voters are old, and will die soon, and it isn’t fair for them to have so much power over a world they won’t even be living in.

Many of the people who voted are 65 years old or over. Understanding New Zealand found a correlation of -0.43 between voting for the ALCP in 2017 and being aged 65+. People this old are incapable of changing their minds to accommodate new information. They will simply reject any new knowledge on the grounds that, if it was true, they would already know it.

As such, their votes should be discounted. If such a discounting is made, and the votes of the people who will have to live with the consequences weighed more heavily, the balance shifts in favour of cannabis law reform.

The sixth reason is that the National Party has already set the precedent, with the asset sales referendum, that it can do what it likes despite the will of the people.

The Asset Sales referendum of 2013 saw John Key’s Fifth National Government soundly defeated, with 67% against. Key sold our assets anyway, on the basis that National’s General Election win in 2014 gave them a mandate to do so. If winning an election gives a party a mandate to override 67% of the people, then the Sixth Labour Government definitely have a mandate to override 53% of the people.

The seventh reason is that a considerable proportion of No voters were dissatisfied with the Cannabis Legalisation and Control Bill itself, and not with the idea of legal cannabis.

The Cannabis Legalisation and Control Bill had a number of major flaws. Most obviously, there was no good reason to restrict cannabis to 15% THC, nor to a miserable two plants per person (which makes cloning from your own mother plant impossible). Some people who wanted legal cannabis did not support the bill on account of these flaws. Some other cannabis supporters didn’t want to pay taxes on cannabis, fearing that this would make their current supply more expensive.

Others just thought the Legalisation and Control Bill was poorly written. So there are many groups of people who are all cannabis law reform supporters but were not supporters of the Legalisation and Control Bill. Therefore, their No votes cannot be taken as votes in favour of cannabis prohibition.

The eighth reason is that a large number of voters were misled by a well-funded campaign of lies.

Democratic referendums assume that the population is correctly informed about the issue under discussion. This assumes that both sides of it are somewhat honest. In the case of the New Zealand referendum, the likes of Bob McCoskrie and Aaron Ironside lied without shame about every aspect of legalisation, claiming falsely that experiences with cannabis legalisation overseas had led to more teen use, more violent crime and more injuries from traffic crashes.

It was never a level playing ground. The campaign of lies from Say Nope to Dope needed to be countered by an official response that made reference to the facts, and it never was. Accounting for the effect of this bombardment of falsehoods would be to credit the Yes side with a large number of extra votes.

The ninth reason is that the No side had a great deal of foreign funding.

The American Church of Scientology funded the No campaign to the tune of at least six figures. Another American outfit known as Smart Approaches to Marijuana, which helped to defeat cannabis law reform measures in several American states, also worked closely with the Say Nope to Dope campaign. The Family First charity mysteriously doubled its income in a few short years, and this resulted in letterbox drops and large advertisements in major newspapers and television.

Many New Zealanders are appalled by the fact that cannabis prohibitionists in this country would team up with foreigners against their own people. In any case, most New Zealanders agree that we shouldn’t allow foreigners to influence New Zealand elections. Cannabis should be made legal to defy the foreigners who sought to interfere in our election.

The tenth, and major reason, is that cannabis prohibition has still failed. Just because 53% of the population support it, doesn’t mean that it has succeeded.

All of the arguments for cannabis law reform, such as the ones laid out in The Case For Cannabis Law Reform, are still valid. Prohibition has still failed to keep vulnerable people safe, it still funnels millions of dollars to gangs, it still causes people to hate the Police and it’s still an affront to human decency.

The ten reasons outlined in this essay are enough that the Sixth Labour Government ought to legalise cannabis despite the referendum result. The arguments that saw support for prohibition fall from 80% to 53% over the past decade are still valid, and those who support prohibition will soon be a minority.

*

If you enjoyed reading this essay, you can get a compilation of the Best VJMP Essays and Articles of 2019 from Amazon for Kindle or Amazon for CreateSpace (for international readers), or TradeMe (for Kiwis). A compilation of the Best VJMP Essays and Articles of 2018 and the Best VJMP Essays and Articles of 2017 are also available.

*

If you would like to support our work in other ways, please consider subscribing to our SubscribeStar fund. Even better, buy any one of our books!

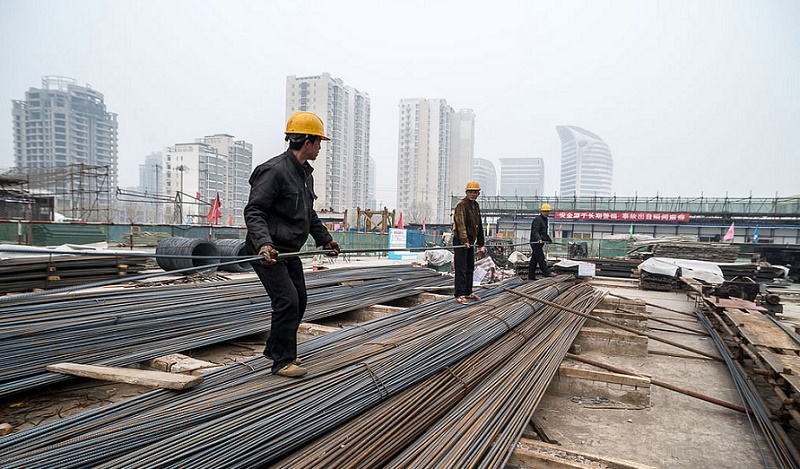
How Long Until Chinese Wages Surpass Kiwi Wages?

Most Kiwis take it for granted that they are much wealthier than the average Chinese. China is a place where people shit in the street, eat dogs and live in houses made of bamboo and polystyrene. The fact, however, is that China has made immense economic progress over the past 20 years, and if they continue at this rate they will soon catch up to New Zealand.

Most people vaguely understand that China has become richer recently. But most don’t appreciate how far this process has run. The general assumption is that China is no longer Africa poor, but is now Brazil poor. The reality is that the average Chinese is now wealthier than the average Argentinian and is getting wealthier fast.

Chinese wages have increased tenfold over the last 20 years. In 2000, the average Chinese wage was CNY9,371/year. By 2019, the average Chinese wage was CNY 93,383/year, which works out to $(NZD)20,910. The Chinese are well into the middle-income stage of development and are closing in fast on the rich world.

The average New Zealand wage is $33.37 per hour, and the average Kiwi works 1,762 hours per year. This gives an average Kiwi wage of $58,798. This means that Kiwi wages are, for now, 181% higher than Chinese ones. But the rate of increase of Chinese wages is much higher than that of Kiwi wages. Chinese wages will soon catch up.

As mentioned above, the average Chinese wage has increased from CNY9,371 in 2000 to CNY93,383 today, an increase of 997%. This is equivalent to a 12.2% increase every year since 2000, and means that Chinese wages double every six years or so.

The average Kiwi wage has increased from $17.50 in 2000 to $33.37 today, an increase of 91%. This is equivalent to a 3.3% increase every year since 2000. As this column has previously shown, this represents a drastic loss in living standards on account of that house prices have risen much faster than wages. But it’s set to get worse.

There is no guarantee that those rates of growth will maintain, but it’s apparent that the Law of Diminishing Returns has worked to increase Chinese wages much faster than Kiwi wages. Assuming that something like those rates of growth maintain, then it won’t be long before the average Chinese wage surpasses the average Kiwi one.

If we assume that Chinese wages increase at 10% hereafter, and Kiwi wages increase at 3% (the high growth model), then it will take no more than 16 years before Chinese wages are higher than Kiwi ones. At this point, both Chinese and Kiwi wages should be around $95,000.

If we assume that Chinese wages increase at 8% hereafter, and Kiwi wages increase at 2.5% (the medium growth model), then it will take around 20 years before Chinese wages are higher than Kiwi ones.

If we assume that Chinese wages increase at 6% hereafter, and Kiwi wages increase at 2% (the low growth model), then it will take around 27 years before Chinese wages are higher than Kiwi ones.

In any case, the maths suggest that it won’t be much more than one generation before the average wage-earner will earn more, in absolute terms, in China than in New Zealand. The average person reading this article should live to see a world in which Chinese wages are higher than New Zealand wages.

What that means for New Zealand is anyone’s guess. The real tricky questions will be faced by naturalised Chinese New Zealanders whose parents left China when there were much better opportunities in New Zealand. Some of those people might sit down, do the maths, and decide that there are now much better opportunities in China.

*

If you enjoyed reading this essay, you can get a compilation of the Best VJMP Essays and Articles of 2019 from Amazon for Kindle or Amazon for CreateSpace (for international readers), or TradeMe (for Kiwis). A compilation of the Best VJMP Essays and Articles of 2018 and the Best VJMP Essays and Articles of 2017 are also available.

*

If you would like to support our work in other ways, please consider subscribing to our SubscribeStar fund. Even better, buy any one of our books!