Many people browsing through the NZ mainstream media recently have thought to themselves: “this is absolute crap!” And it is – but not because the editors of the mainstream media are incompetent or stupid. To the contrary, they know precisely what they’re doing.
Although it’s usually denied, a people’s main concerns and desires are not always organically and naturally generated, but are often implanted in their minds by the controllers of the apparatus of propaganda. These controllers consciously decide which ideas they want implanted in the minds of the masses, and then use the apparatus of propaganda to normalise those ideas through repetition.
There are, therefore, understandable and logical reasons why the mainstream media runs thousands of articles and segments about utterly inconsequential issues.
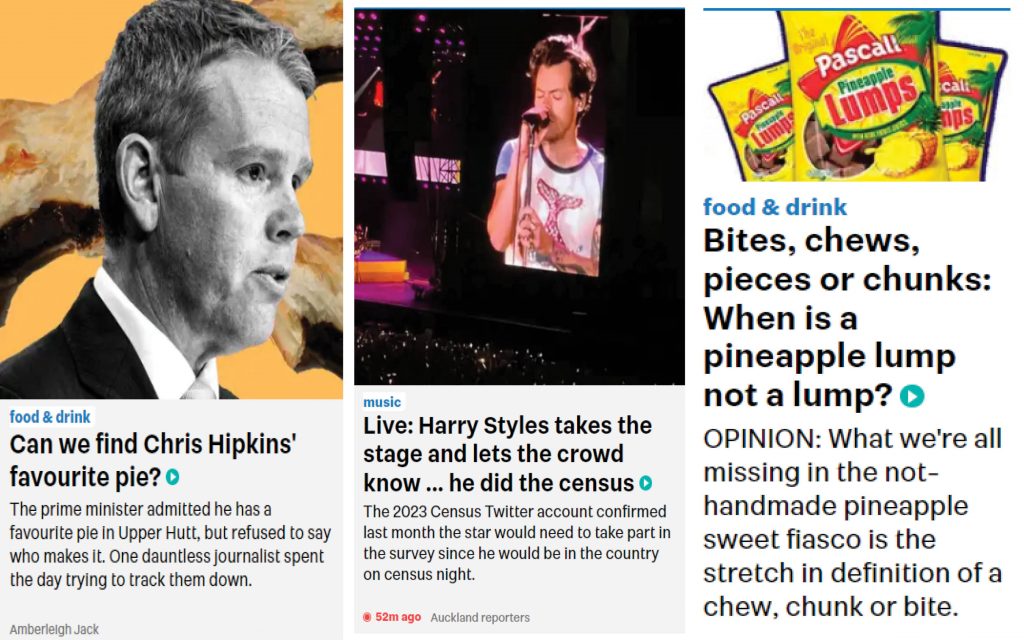
By constantly promoting trivia, the mainstream media normalises the idea that the nation has no pressing concerns; everything is running well, and there’s no cause for any alarm. If journalists can be sent looking for Chris Hipkins’s favourite pie, or tasked to write 2,000 words about the finer points of pineapple lumps, then it’s natural to assume that they have nothing more important to wrote about, and so one shouldn’t complain.
The trivia promoted is usually one of a few common types. Celebrity trivia is the most common of these. Sporting trivia is also very common. Particularly common right now is drama about transgenders and transgender rights, hence the shitstorm over Posie Parker’s planned visit to New Zealand. When transgender rights become boring, the media will move on to some other issue that affects less than 0.5% of the population.
The total effect of pushing all this trivia is the normalisation of the idea that there’s nothing important to complain about, so we should just march happily to work, then back home to watch television and to consume pies and pineapple lumps, before another day of the same, every day for the rest of our lives.
The mainstream media’s normalisation of trivia serves the purposes of the ruling class in two major ways.
The first is by filling the minds of the people with garbage. This is a deliberate strategy to make people unable to come together and build a resistance movement. The more trivia in people’s minds, and the more trivia in their general conversations, the less they can build deep and true bonds of friendship.
To that end, the mainstream media employs the strategy of “flooding the zone”. They produce so much garbage that it floods the social media feeds of people on FaceBook, Twitter, YouTube, TeleGram, Reddit, SnapChat, Discord, InstaGram and anywhere else people gather to discuss current events. Now, no serious person can get talk of revolution started because everyone’s constantly talking about crap.
After a flood of propaganda normalising trivia, anyone who talks about serious political issues now becomes unpopular. Their seriousness makes them abnormal. That abnormality means that people soon get tired of their heavy vibes. When people become normalised to media garbage, they want more and more of it, the same way a daily McDonald’s eater does.
The second is by preventing the discussion of important issues. The ruling class doesn’t want discussion of housing, mental health, wages or child abuse because all of these issues can only realistically be solved by forcing that ruling class to siphon less wealth from the masses. To that end, the more trivia the better.
Any position that suggests that the ruling class might have to change anything about their own actions is forbidden. The only people obliged to change their ways are the plebs, hence all the talk about how individuals (and not corporations) need to cut consumption. Promotion of triviality pulls things down to the most trivial level, that of the individual.
Anyone talking about anything serious is ostracised as a bore or a fanatic. Who cares about mental health? I want to know what Ed Sheeran thinks of New Zealand! Who cares about the labour share of production? I want to hear from the sexual deviant of the week about how everyone is a Nazi! And so it becomes even more difficult to arrange any true resistance to the ruling class.
Job done.
There’s no easy way around this. Apart from becoming the Government ourselves and redirecting Public Interest Journalism Fund money, the easiest way is to become the media ourselves: writing and talking about issues of actual importance to everyday people, and laying out a clear plan by which change can be effected.
A recent VJM Publishing article had noted that support for Australian Establishment parties had fallen heavily since World War Two. Australian dissatisfaction with their rulers has never been higher, and this is not a phenomenon restricted to Australia. Support for the ruling class is collapsing all over the West.
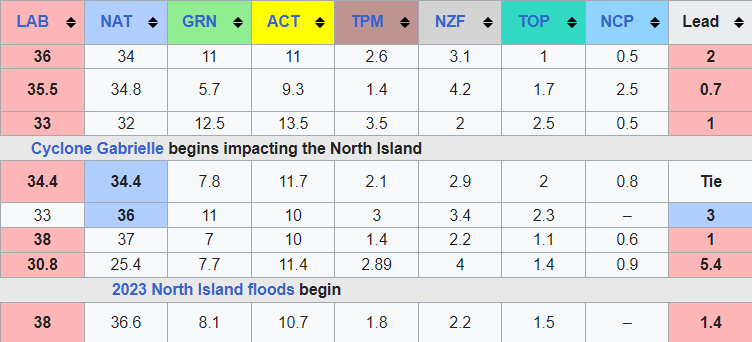
It’s the same in New Zealand: Establishment parties (i.e. Labournational) are losing total support. Labournational scored 75.6% of the total vote in the 2020 General Election, down from 81.3% in 2017. According to recent polling from RoyMorgan, Labournational stands to win as little as 65% of the total vote in this year’s General Election.
In Holland this week, the BBB party came from nowhere to win 15 out of 75 seats in the Dutch Senate. The BBB party was founded in 2019 as a protest movement whose main grievance was globalist-instigated farm shutdowns. The party of the current Prime Minister, Mark Rutte, could only manage ten seats.
Last year, in Sweden, the nationalist Sweden Democrats caused chaos by becoming Sweden’s second-largest party. The negotiations to form the next government created no end of headaches for the Swedish Establishment, which is thoroughly globalist and did not anticipate having to share power with their nationalist enemies.
In Germany, the nationalist AfD is polling at around 15%. In Spain, the Vox Party, which has been labelled “far-right extremists” by the usual suspects, is polling at around 15%, and had been polling around 20% as recently as one year ago. In Finland, the True Finns, a nationalist rural populist movement following a similar model to the Dutch BBB, is polling at around 20%. In Italy, the Brothers of Italy, a nationalist conservative movement, is polling at around 30%.
It’s only in the Anglosphere, where nationalist movements are rapidly infiltrated and destroyed by intelligence services, where no such movement has taken off yet (although nationalist parties won about 10% of the total vote in the last Australian General Election).
The main reason for the rise in support for alternative parties is because of the ongoing collapse of living standards in the Western World.
When society is going well, people don’t feel much need to change anything. When the economy’s growing, and people can pay their bills easily, and they can afford to buy houses and raise families, maintaining the status quo seems like a good idea.
When society is going poorly, and people’s disposable incomes are getting chewed up by inflation, and the average worker can’t afford a home, and the prospect of raising a family looks unachievable even if you can find a decent partner, revolution starts to look tempting.
The collapsing support for the Establishment parties in the West can be seen as a sign of ongoing social collapse. As the knowledge and wisdom that underpins our scientific, industrial and economic power continues to dissipate, dissatisfaction with the ruling class will continue to rise.
Unfortunately for us, some degree of future dissatisfaction is hard-baked into our economies on account of that they’re powered by fossil fuels, which are finite and undergoing depletion. Fossil fuel depletion will eventually lead to inflation on a scale not seen outside of Weimar.
Even if this was not the case – say, if cheap renewable energy was developed and rolled out in short order – the greed of the ruling classes means that the masses will receive less and less of a share of production as time goes on. The wage share will continue to decrease as the ruling class uses its excess wealth to leverage even more wealth out of the masses.
Thus, we can expect that the future will give us more and more dissatisfaction with our ruling classes, as the dumb animal mass that is the voting public takes out its primal frustrations on their surrogate parents in the world’s parliaments. Whether this will lead to any true revolutionary movement remains to be seen, but we can expect that the process will entertain the gods.
What the Establishment really, really doesn’t want is for total support for its two favoured parties to fall below 50%. If this should happen, it raises the possibility of an actual opposition party (i.e. a party not controlled by the Establishment) or coalition taking control. From the point of view of the Establishment, losing control is the same thing as falling into chaos. They will do anything to prevent it.
If support for the Establishment parties falls below 50% in any Western country, and if this leads to a true opposition movement taking control, we can expect the ruling class to throw a once-in-a-century tantrum. Assassinations, terrorist sabotage and fomenting unrest through funding globalist counter-revolutionaries (such as Antifa) are all possible.
Observers have noticed that conservative forces have thrown themselves whole-heartedly behind the gay pride movement. This seems like a extraordinary change in attitude, considering that conservatives were for so many years the reason that homosexuality was banned. The explanation for this change is actually very simple.
All sections of the ruling class push identity politics in order to distract from class politics.
Politicians don’t really care if men fuck other men up the arse or not. What they care about is maintaining their position at the top of the dominance hierarchy. And the way to do that, as it always has been, is through divide and conquer. Split the masses up and set them against each other: that way, they don’t attack the people above them.
Identity politics, a.k.a. idpol, is the most effective way to divide and conquer. Instead of identifying with their class interests – and viewing the ruling class as their collective enemy – the masses are trained to identify with immutable, natural characteristics, such as race, gender and sexuality, and to hate “bigots” and “racists”. Class concerns are considered less important, and so fall from awareness.
The reason why all differences in economic outcomes between races are considered evidence of racism, and why all differences in economic outcomes between genders are considered evidence of sexism, is because narratives of racism and sexism are essential to divide and conquer the masses. So the ruling class has to whip the masses into hysteria about racial and sexual injustices.
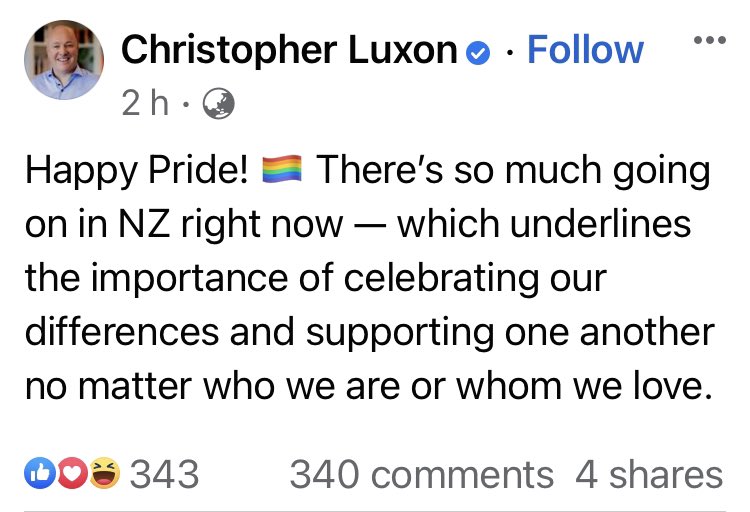
Despite being the leader of a supposedly conservative party, Christopher Luxon can promote homosexuality because he knows that the battle for homosexual acceptance is a distraction from class politics. The more people worry about rights for homosexuals, the less energy they have to worry about rights for the working class. Therefore, promoting this battle serves the interests of the ruling class by weakening their enemies.
Ideally, the population could be manipulated into thinking that politics was all about race, gender and sexuality, and nothing else. Such an outcome would push class concerns to the bottom of the priority list. That way, the ruling class could continue to suck profits, taxes and rents out of the masses without those masses even thinking about coming together to resist.
Cha-ching.
The divide and conquer strategy is sophisticated. The ruling class has to be careful not to campaign for any issue that might inadvertently unite the masses. So they don’t campaign to prevent any actual injustices, like homelessness, the War on Drugs, mental healthcare access or the food inflation resulting from mass money printing in recent years.
Luxon has no interest in promoting cannabis law reform, because cannabis is mostly used by poor people and therefore the issue does not divide the working class as effectively as race, gender and sexuality. The Labour Party doesn’t promote cannabis law reform either, and for the same reason. Neither does the Maori Party, even though almost 80% of Maoris voted for legal cannabis in 2020. Representatives of all of these parties are members of the ruling class first and foremost.
The simple rule is that the ruling class promotes any issue that causes the people to fight and bicker with each other, and ignores any issue that causes the people to unite.
The fact that the working class doesn’t care about the right to fuck a 16-year old boy up the arsehole is precisely why the ruling class promotes pride parades. That way, the ruling class can scream “homophobe!” at anyone who thinks housing or wages are more important issues. Anything to keep the working class at each other’s throats.
And so, the more politicians fight (or pretend to fight) over race, gender and sexuality, the further the working class sinks into the swamp of wage slavery. Never before has more attention been paid to identity politics, and never before has the position of Western workers been worse. These two facts are directly related.
Although most don’t realise it, white people not being allowed to have a white identity is also identity politics. It might be assumed that the promotion of identity politics implies the promotion of a white identity. That is not the case. If every race were allowed to have an identity, we would all know our place and would get along reasonably well.
Maximum division necessitates that white people be denied an identity. This leads to a sense of injustice, which leads to anger. This anger is then directed away from the ruling class by the apparatus of propaganda, which the ruling class controls. This propaganda declares that any white person seeking a white identity is pilloried as a racist or a terrorist.
In summary, the ruling class pushes identity politics to divide and conquer the masses, and to distract from class issues. They have done this ever since the first wave of feminism in the 19th Century. Their efforts intensified after Occupy Wall Street.
The only realistic solution is for a new breed of politicians, who reject identity politics, to rise in the West.
The Maori Party won 33,630 votes in the 2020 General Election, for 1.17% of the total vote. They have been getting a lot of media coverage recently, and have been climbing in the polls as a result, and are now looking to expand their support into previously untapped demographics. This chapter explains who voted for them in 2020.
The obvious assumption is that Maori people vote for The Maori Party, but it’s not as simple as that. For one thing, a significant number of non-Maoris vote for The Maori Party. For another, the Maoris who do vote for The Maori Party are not necessarily representative of the Maori population as a whole.
This chapter will therefore focus mostly on the differences between the average Maori Party voter and the average Maori, and not on the differences between the average Maori Party voter and the average Kiwi. Generally speaking, the average Maori Party voter is significantly more enfranchised than the average Maori, and this is characteristic of the difference between the two populations.
Variable
Voting Maori Party in 2020
European
-0.31
Maori
0.91
Pacific Islander
0.06
Asian
-0.32
Some Kiwis of European descent and Asians vote for The Maori Party on account of general anti-Establishment sentiments. To some, it feels as if Labour, National, The Greens and ACT are all part of the one Establishment. Some votes for The Maori Party, then, are effectively protest votes. Some Pacific Islanders might have voted for The Maori Party on account of general pan-Polynesian sentiments.
The support of any of these three racial groups, however, were dwarfed by Maori support for The Maori Party. The correlation between being Maori and voting for The Maori Party in 2020 was 0.91, one of the strongest in this entire survey.
Variable
Voting Maori Party in 2020
Being Maori
Voting Labour in 2020
-0.37
-0.33
Voting National in 2020
-0.71
-0.65
Voting Greens in 2020
-0.15
-0.27
Voting ACT in 2020
-0.64
-0.58
Voting NZF in 2020
0.07
0.32
Voting New Conservative in 2020
-0.57
-0.44
Voting ALCP in 2020
0.81
0.88
Voting Advance NZ in 2020
0.47
0.63
Curiously, there was a significant negative correlation between voting Maori Party in 2020 and voting either Labour in 2020 (-0.37) or voting National in 2020 (-0.71). The least strong negative correlation between voting Maori Party in 2020 and voting for any of the four other Parliamentary parties in 2020 was with The Greens, at -0.15.
Two of the most striking correlations are these: 0.81 between voting Maori Party in 2020 and voting ALCP in 2020, and 0.88 between being Maori and voting ALCP in 2020. Considering that cannabis prohibition is one of the best examples of a colonial law that disproportionately harms Maori people, one might think there was a great opportunity there for The Maori Party to oppose it.
Some might be surprised to see such an overlap between Maori Party voters and New Zealand First voters. After all, the former are characterised in the mainstream media as far-left extremists and the latter as far-right extremists. The reality is that the former are Maori nationalists and the latter are Kiwi nationalists, and because so many Kiwis are Maori and because white Kiwi nationalists are usually pro-Maori, the two populations have much in common.
Variable
Voting Maori Party in 2020
Being Maori
No qualifications
0.34
0.53
Level 1 certificate
0.28
0.46
Level 2 certificate
0.44
0.59
Level 3 certificate
0.51
0.46
Level 4 certificate
0.33
0.52
Level 5 diploma
0.24
0.37
Level 6 diploma
-0.64
-0.67
Bachelor’s degree
-0.34
-0.53
Honour’s degree
-0.38
-0.55
Master’s degree
-0.31
-0.50
Doctorate
-0.28
-0.43
Maori Party voters are much better educated than the average Maori. Not only are they much more likely to have gone past high school, they’re also much more likely to have a degree.
Maori Party voters were significantly less likely to have a university degree than the average Kiwi, but none of the correlations between voting Maori Party in 2020 and having any of the degrees were stronger than -0.38. By contrast, all of the correlations between being Maori and having any of the degrees were stronger than -0.43.
These correlations reveal the basic truth about Maori Party voters: they represent the Maori elite, and are in many ways more like middle-class white people than they are like the average Maori.
Variable
Voting Maori Party in 2020
Being Maori
Living urban
-0.26
-0.39
Maori Party voters are much more urban than Maori people in general. This is a useful clue when it comes to understanding the average Maori Party voter.
Urban life tends to be cosmopolitan and therefore tends to cultivate pro-globalist sentiments. So if Maori Party voters are more urban, they can be expected to have some globalist sympathies. The average rural Maori is much more likely to favour New Zealand First than the Maori Party.
Urban areas are also where the power is, and the fact that Maori Party voters are more likely to be urbanites than Maoris in general demonstrates the extent to which Maori Party voters are more enfranchised.
Variable
Voting Maori Party in 2020
Being Maori
Median income
-0.11
-0.30
Mean income
-0.08
-0.25
Maori Party voters in 2020 were significantly wealthier than Maoris in general. In fact, the average Maori Party voter in 2020 was not much poorer than the average New Zealander. The average Maori, by contrast, is significantly poorer.
Understanding the correlations of education and wealth, a distinct class division within Maoridom becomes evident. The majority of Maoris tend to vote for the Labour and New Zealand First parties, and these make up the broad Maori masses. The Maori elites, who expect to be granted Government subsidies and handouts, tend to vote for The Maori Party.
Variable
Voting Maori Party in 2020
Being Maori
Managers
-0.36
-0.36
Professionals
-0.27
-0.43
Technicians and Trades Workers
-0.07
0.03
Community and Personal Service Workers
0.51
0.56
Clerical and Administrative Workers
-0.19
-0.27
Sales Workers
-0.04
-0.15
Machinery Operators and Drivers
0.32
0.43
Labourers
0.42
0.58
In comparison to the average Maori, the average Maori Party voter is much more likely to be a professional or a clerical and administrative worker, and much less likely to be a technician and trades worker, a machinery operator or driver or a labourer.
This reinforces the class narrative noted above. Maori Party voters are much more likely to be independent professionals or important members of the Government machinery, whereas Maoris in general are more likely to have working-class professions.
Variable
Voting Maori Party 2020
Being Maori
Working in agriculture, forestry or fishing
0.06
0.23
Working in mining
0.05
0.08
Working in manufacturing
0.16
0.28
Working in electricity, gas, water and waste
0.17
0.29
Working in construction
0.15
0.20
Working in wholesale trade
-0.21
-0.31
Working in retail trade
-0.15
-0.15
Working in accommodation and food services
0.04
-0.05
Working in transport, postal and warehousing
0.42
0.41
Working in information media and telecommunications
-0.14
-0.32
Working in financial and insurance services
-0.22
-0.40
Working in rental, hiring and real estate services
-0.30
-0.40
Working in professional, scientific and technical services
-0.28
-0.46
Working in administrative and support services
0.33
0.29
Working in public administration and safety
0.05
0.04
Working in education and training
0.10
0.09
Working in healthcare and social assistance
-0.06
0.02
Working in arts and recreation services
0.10
-0.03
Looking at occupations, the pattern mentioned above reappears: the more working-class an occupation is, the fewer Maori Party voters it will have in comparison to Maori people in general.
This is most obvious with occupations such as agriculture, forestry and fishing. The correlation between working in this occupation and voting Maori Party in 2020 (0.06) was much weaker than the correlation between working in this occupation and being Maori (0.23). Similar gaps were seen with manufacturing (0.16 and 0.28, respectively) and electricity, gas, water and waste (0.17 and 0.29, respectively).
The opposite pattern was seen with middle-class occupations. The correlation between working in professional, scientific and technical services and voting Maori Party in 2020 (-0.28) was also much weaker than the correlation between working in this occupation and being Maori (-0.46), only negative. Similar gaps were seen with financial and insurance services (-0.22 and -0.40, respectively) and information media and telecommunications (-0.14 and -0.32, respectively).
This supports the tendency that Maori Party voters tend to be more middle-class than Maori people in general.
Variable
Voting Maori Party in 2020
Being Maori
% VAP Enrolled
-0.37
-0.40
Turnout rate
-0.69
-0.67
Many will be surprised to see that the turnout rate is actually lower for the group voting Maori Party in 2020 than for the group who are Maori. If Maori Party voters are more middle-class than Maori people in general, and if middle-class people vote more often working-class ones, then it seems paradoxical that Maori Party supporters would vote less often than Maori people in general.
The reason why can be explained by the demographics below: Maori Party voters are younger than Maoris in general, and younger people are less likely to vote.
Variable
Voting Maori Party in 2020
Being Maori
Median age
-0.01
0.05
Mean age
0.01
0.04
Maori Party voters are slightly younger than Maori people in general. One major reason for this is that The Maori Party is a radical party and young people are more attracted to radical politics. Another major reason is that The Maori Party is a relatively new party, and so has not had time to build lifetime allegiances, in contrast to Labour and New Zealand First. A third reason is that older Maoris tend to be more assimilationist than younger ones.
Variable
Voting Maori Party in 2020
Being Maori
Married (not separated)
-0.69
-0.66
Divorced/separated/widowed
-0.11
0.09
Never married
0.65
0.56
Given that getting married is more common among middle-class Kiwis than among working-class ones, it might come as a surprise that Maori Party voters are less likely to get married than Maori people in general.
The explanation is simple: because Maori Party voters are younger than Maori people in general, they have had less time to get married. This is also why the correlation between never being married and voting Maori Party in 2020 (0.65) was stronger than the correlation between never being married and being Maori (0.56).
The relatively middle-class nature of Maori Party voters reveals itself when comparing the correlation between being divorced/separated/widowed and voting Maori Party in 2020 (-0.11) with the correlation between being divorced/separated/widowed and being Maori (0.09), as middle-class people are, on average, much less likely to get divorced.
Variable
Voting Maori Party 2020
Being Maori
Own or part own house
-0.43
-0.32
Own house in family trust
-0.47
-0.51
Neither ownership nor family trust
0.53
0.45
It might come as a surprise to some that the average Maori Party voter is less likely to own their own home than the average Maori, as homeownership is typically middle-class and Maori Party voters tend to be more middle-class than Maoris in general.
However, it can be readily explained by the fact that Maori Party voters are much more urban than Maoris in general, and urban dwellers are more likely to be renters than homeowners. Furthermore, Maori Party voters are younger than Maoris in general. These two factors explain the lower homeownership rates.
Variable
Voting Maori Party 2020
Being Maori
No children
-0.02
-0.20
One child
-0.03
-0.14
Two children
-0.49
-0.47
Three children
-0.08
0.09
Four children
0.34
0.55
Five children
0.56
0.74
Six children
0.59
0.73
The average Maori Party voter is significantly less likely to have children than the average Maori. There are multiple reasons for this.
The foremost is the previously-mentioned class differences. Maori Party voters tend to be more middle-class than Maori people in general, and middle-class people have fewer children than working-class ones. There is also an age effect – Maori Party voters tend to be slightly younger than Maori people in general, and therefore have had less time to have children.
Variable
Voting Maori Party 2020
Being Maori
Income < $5,000
0.26
0.16
Income $5,000-$10,000
0.38
0.32
Income $10,000-$20,000
0.39
0.59
Income $20,000-$30,000
0.08
0.26
Income $30,000-$50,000
0.03
0.14
Income $50,000-$70,000
-0.40
-0.48
Income > $70,000
-0.35
-0.51
As mentioned in the previously discussed correlations, Maori Party voters tend to be more middle-class than Maori people in general. This is reflected everywhere, including (as most would expect) in income.
Although the average Maori Party voter was more likely than the average Maori to fall into the lowest income bands (those below $10,000), this can be explained by the fact that Maori Party voters are more likely to be students. The average Maori is considerably more likely to belong to the bands typical for working-class Kiwis ($10,000-$50,000).
The largest gap was with the correlation between having an income above $70,000 and voting Maori Party in 2020 (-0.35) and between having an income above $70,000 and being Maori (-0.51). This demonstrates that, all other things being equal, the wealthier a Maori person is, the more likely they are to vote Maori Party.
Variable
Voting Maori Party 2020
Being Maori
Being male
-0.08
-0.06
Other commentators have previously observed that Maori Party voters tend to be more female than male. This mystifies some because there’s no obvious reason why Maori Party policy should appeal more to women than to men.
The explanation is that Maoris in general tend to be more female than male. This is owing to the relatively high death rate among Maori males, a function of high rates of alcohol use, extremely high rates of tobacco use, and disproportionate rates of suicide. As such, because of the extremely strong correlation between being Maori and being a Maori Party voter, it follows that most Maori Party voters are female.
In summary, Maori Party voters occupy similar demographics to Maoris in general, which is unsurprising given the strength of the correlation between the two populations.
The main difference between Maori Party voters and Maoris in general is that the former are more globalist, the latter more nationalist. This is a function of the fact that Maori Party voters are much more part of the Establishment than the average Maori is. The more that any given Maori individual is likely to be close to the levers of power, the more likely they are to vote Maori Party.
*
This article is an excerpt from the upcoming 3rd Edition of Understanding New Zealand, by Dan McGlashan and published by VJM Publishing. Understanding New Zealand is the comprehensive guide to the demographics and voting patterns of the New Zealand people.