
How Long Until Wages Catch Up To The Housebuying Power Of 1992?

The long-term strategy for building economic wealth appears to be holding house prices steady while waiting for wages to catch up. This article does the maths to answer one question: how long until the average wage has the same housebuying power of the average wage in 1992?

In 1992, the average New Zealand house price was $105,000. The average wage at that time was almost $15 per hour. This means that most Kiwis found themselves able to buy a house after 7,000 hours of labour.

By 2021, the average New Zealand house price has climbed to some $750,000, while the average wage languishes at around $34 an hour. This means that most Kiwis today are looking at putting in 22,000 hours of labour before they can get to the position of homeownership.

Economists predict that the average New Zealand house price will increase by double-digit percentages in 2021. 5% increases are expected for the two years after that, up until March 2024, which is as far ahead as anyone responsible will try to predict.

Let’s make two assumptions: firstly, that these forecasts are broadly correct; secondly, that house prices stop increasing after March 2024, allowing wages to catch up.

This suggests that house prices will top out at a national average of about $910,000 ($750,000 x 1.10 x 1.05 x 1.05). This assumes that they increase by around 10% in the year to March 2022, and then 5% for the two years after that, before remaining stable thereafter. The reality is, of course, anyone’s guess, but let’s say for simplicity’s sake that house prices reach $910,000 by March 2024 and then stay there in perpetuity.

To buy a $910,000 house with 7,000 hours of labour, a worker would have to be getting paid $130 per hour. Assuming that all other things (labour share, taxes, rents, non-rent living costs) are equal, $130/hr is what the average wage would have to be for the average worker to have the same housebuying power as the average worker in 1992.

As mentioned above, the average wage in New Zealand is around $34 right now. This means that it has to increase 3.82 times for the average worker to have the same housebuying power that the average worker had in 1992 – without house prices increasing beyond March 2024.

Wage growth over the past 28 years in New Zealand, from just under $15 an hour in 1992 to around $34 an hour at the end of 2020, has run at about 3% per annum.

If we assume future wage increases of 3% per annum, and no further house price increases beyond March 2024, then we will have to wait around 48 years for the average wage to catch up to the housebuying power that the average wage had in 1992.

In reality, it’s unlikely that house prices will remain exactly the same for the next 48 years. When the Boomers start dying off en masse, beginning in about 15 years, the demand for housing will rapidly fall all across the Western World. At that point, house prices could go in any direction depending on how much immigration takes place.

Of course, if house prices continue to increase beyond March 2024, then wages will simply never catch up. The West will become more and more verticalised until we effectively regress into a feudal-style economy where 99% of people are renters for life.

What can be said with confidence, however, is that it will take around half a century, at current rates, for wages to catch up to the point where the average worker has the same housebuying power they had in 1992. And that is even if one assumes that house prices don’t continue to increase.

*

If you enjoyed reading this article, you can get a compilation of the Best VJMP Essays and Articles of 2019 from Amazon for Kindle or Amazon for CreateSpace (for international readers), or TradeMe (for Kiwis). A compilation of the Best VJMP Essays and Articles of 2018 and the Best VJMP Essays and Articles of 2017 are also available.

*

If you would like to support our work in other ways, please consider subscribing to our SubscribeStar fund. Even better, buy any one of our books!

Intergenerational Rape

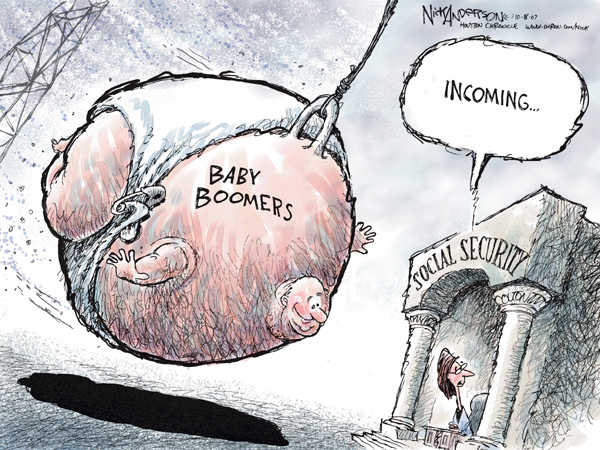
Young people today are starting to realise that the economic system isn’t what it’s claimed to be. Although Boomers keep saying that anyone who works hard will be compensated enough to own a home and raise a family in it, few young people still believe them. The truth, now widely understood, is that the entire system has been rigged to benefit the old at the expense of the young.

What the Boomers have done can rightly be termed intergenerational rape.

The “postwar generation” has taken advantage of their political power over the younger generations to subject those young people to a degrading level of servitude and hopelessness. Young people nowadays have found themselves effectively enslaved, working long hours and then having to fork out so much in profits, taxes and rents that they have little left for themselves.

The Boomers have tilted the scales so that every operation of the economic system favours them to the exclusion of everyone else. They are sucking the life energy out of the younger generations, and for no other reason than their own greed. Nowhere is this more evident than in the fact that the Millennial generation controls less than a quarter of the wealth that the Boomers controlled at the same age.

The intergenerational social contract, according to which the elderly sacrificed their wealth so that their offspring could be strong, has been annihilated by the Boomers. Instead of nurturing the following generations, the Boomers have plundered them. Boomers credit themselves for working hard and investing prudently, but the reality is that they have built their wealth on the impoverishment of those to follow.

They have done this by using their voting power to elect politicians who were willing to pass laws dispossessing the young. Everywhere that a balance needs to be struck – employer or employee, landlord or tenant, pension recipient or taxpayer, borrowing and spending now or saving for the future – the law favours the Boomers.

This intergenerational favouritism is stark if one considers house prices.

Boomers in 1992 were able to purchase the average New Zealand house for $105,000. As the average wage was above $14 per hour back then, it means that the average house cost about 7,000 hours of labour. It means that, if a person was able to save about a third of their income, they could buy a house after ten years of full-time work. Good times.

By today, when the Boomers own all the houses, the average house price has increased by seven times from 1992 levels, but the average wage only slightly more than twice. The average New Zealand house now costs more than $740,000, whereas the average wage is around $34 per hour. It means that the average house now costs 22,000 hours of labour. Hard times.

Intergenerational rape is when the Boomers charge 22,000 hours of labour for entry to a circle of wealth (homeownership) that they themselves were admitted to after only 7,000 hours of labour. Whereas the average Boomer was able to buy the average house after ten years of labour, young people are looking at thirty years of labour to get to that position.

All of this economic exploitation serves no other purpose than to keep Boomers in a luxurious state of retirement, with regular holidays, plentiful rich food and first-class medical care.

The Boomer generation has inherited an enviable level of wealth from their predecessors and then pulled up the ladder so that none of their descendants can share in it. The Boomers have behaved in this manner because they are the single most selfish and godless generation to have existed in human history. Never before has there been a generation of people willing to put their own whims and fancies above the physical needs of their own offspring.

Their actions could be compared to those of a meth addict who passes out on the couch while their children run around in the streets looking for food. It’s a degree of reckless neglectfulness that ought to be criminal.

The Boomers, however, will get what they deserve. They are mortal after all, and the eldest of them are already 75 years old. Within three decades, almost all of them will be gone. As this column has written previously, God will return to Earth when the Boomers finally die off. They represent peak godlessness, and their passing will result in a new spiritual age.

It is unlikely that intergenerational rape will end owing to any action taken by younger people. The generations following the Boomers are too divided, too demoralised and too apathetic to do anything about their situation. They will have to wait for the Boomers to die off – which means that the rape will continue for another 30 years yet.

*

If you enjoyed reading this article, you can get a compilation of the Best VJMP Essays and Articles of 2019 from Amazon for Kindle or Amazon for CreateSpace (for international readers), or TradeMe (for Kiwis). A compilation of the Best VJMP Essays and Articles of 2018 and the Best VJMP Essays and Articles of 2017 are also available.

*

If you would like to support our work in other ways, please consider subscribing to our SubscribeStar fund. Even better, buy any one of our books!

Understanding New Zealand 3: Voting Sustainable NZ in 2020

Vernon Tava’s Sustainable NZ party made a transparent attempt to target the center of the political spectrum. The logic was that they would be an environmentalist movement that wasn’t tarnished by the social justice obsession of the Greens. In the end, they received 1,880 votes, which amounted to less than 0.1% of the total.

VariableVoting Sustainable NZ in 2020
Voting ACT in 20200.54
Voting National in 20200.50
Voting Greens in 20200.26
Voting New Conservative in 20200.37
Voting The Opportunities Party in 20200.32
Voting Labour in 20200.02
Voting Aotearoa Legalise Cannabis Party in 2020-0.41
Voting Maori Party in 2020-0.46

Sustainable NZ may not have won many votes, but they succeeded in positioning themselves somewhere between the National Party and the Green Party. The correlation between voting Sustainable NZ in 2020 and voting National in 2020 was 0.50, and with voting Greens in 2020 it was 0.26. Both are significantly positive.

The correlation between voting Sustainable NZ in 2020 and voting Labour in 2020 was not significant, at 0.02. This suggests that Sustainable NZ was successful in avoiding the label of ‘left-wing’. In fact, there was even a correlation of 0.37 between voting Sustainable NZ in 2020 and voting New Conservative in 2020.

The strongest negative correlations with voting Sustainable NZ in 2020 were with voting for the parties representing disadvantaged demographics, such as the ALCP (-0.41) and the Maori Party (-0.46).

VariableVoting Sustainable NZ in 2020
< $5,000-0.17
$5,000-$10,000-0.11
$10,000-$20,000-0.37
$20,000-$30,000-0.18
$30,000-$50,000-0.32
$50,000-$70,0000.23
$70,000+0.44

The general rule is: the wealthier the voter, the more likely they were to vote Sustainable NZ in 2020. The reason for this, as it is for the Greens and The Opportunities Party, is that environmental issues are high up Maslow’s Hierarchy of Needs, and people suffering from housing or income insecurity will vote on the basis of that instead.

The strongest support of any income bracket for Sustainable NZ came from the $70,000+ bracket. The correlation between voting for Sustainable NZ in 2020 and having a personal income of over $70,000 was 0.44. This is a curious result, given that votes for alternative parties are normally cast by disenfranchised people, and disenfranchised people normally vote for left-wing parties. This paradox may explain why Sustainable NZ got so few votes.

The financially disenfranchised avoided voting for Sustainable NZ. The correlation between having an income between $10,000 and $20,000 and voting Sustainable NZ in 2020 was -0.37.

VariableVoting Sustainable NZ in 2020
No qualifications-0.46
Level 1 certificate-0.22
Level 2 certificate-0.31
Level 3 certificate-0.24
Level 4 certifiate-0.30
Level 5 diploma-0.20
Level 6 diploma0.55
Bachelor’s degree0.36
Honours degree0.40
Master’s degree0.34
Doctorate0.34

As with the Greens, ACT and The Opportunities Party, highly educated voters were more likely to vote Sustainable NZ than poorly educated ones. There was a significant positive correlation between voting Sustainable NZ in 2020 and having any of the university degrees. On the other hand, there was a correlation of -0.46 between voting Sustainable NZ in 2020 and having no academic qualifications.

Unlike the Greens, the correlation between voting Sustainable NZ in 2020 and having a highest educational qualification of a level 3 certificate was significantly negative. This reflects the fact that the Greens have broad appeal among university students, a niche that Sustainable NZ were unable to gain entry to.

From these three sets of correlations, we can see that Sustainable NZ voters were considerably more privileged than the average voter.

VariableVoting Sustainable NZ in 2020
No children0.19
One child-0.02
Two children0.39
Three children-0.05
Four children-0.46
Five children-0.62
Six children-0.64

Sustainable NZ voters walked the talk when it comes to the sustainability of their breeding. The strongest correlation between voting for Sustainable NZ in 2020 and having any number of children was two (0.39). There was also a positive correlation of 0.19 between voting for Sustainable NZ in 2020 and having no children.

On the other hand, there were significant negative correlations between voting Sustainable NZ in 2020 and having four, five or six children. All three of these correlations were at least as negative as -0.46. Sustainable NZ voters are clearly aware that having more than two children is unsustainable.

VariableVoting Sustainable NZ in 2020
Working as a manager0.45
Working as a professional0.31
Working as a machinery operator or driver-0.52
Working as a labourer-0.45

A curious outcome of the election is that there was a significant positive correlation between voting Sustainable NZ in 2020 and both working as a manager and working as a professional. Working as a manager and working as a professional are the archetypal occupations of National and the Greens, respectively.

The working-class occupations, by contrast, were relatively less likely to vote Sustainable NZ in 2020. As mentioned above, people who are worried about housing affordability generally consider environmentalism to be a luxury concern.

In summary, Vernon Tava and his Sustainable NZ movement were successful in positioning themselves in the “blue-green” space that appeals to educated, long-sighted people, whether managers or professionals. The problem is that they failed in the much more important objective of obtaining enough votes to threaten the 5% threshold.

*

This article is an excerpt from the upcoming 3rd Edition of Understanding New Zealand, by Dan McGlashan and published by VJM Publishing. Understanding New Zealand is the comprehensive guide to the demographics and voting patterns of the New Zealand people.

*

If you enjoyed reading this essay/article, you can get a compilation of the Best VJMP Essays and Articles of 2019 from Amazon for Kindle or Amazon for CreateSpace (for international readers), or TradeMe (for Kiwis). A compilation of the Best VJMP Essays and Articles of 2018 and the Best VJMP Essays and Articles of 2017 are also available.

*

If you would like to support our work in other ways, please consider subscribing to our SubscribeStar fund. Even better, buy any one of our books!
Starving The Three Lions

People today work as hard as their parents did, but they have much less wealth. The reason for their relative poverty is that three mighty lions take a share of every worker’s production before it gets to their bank account. These three lions have always existed, but today they are much more ravenous than ever before.

The first lion is profits.

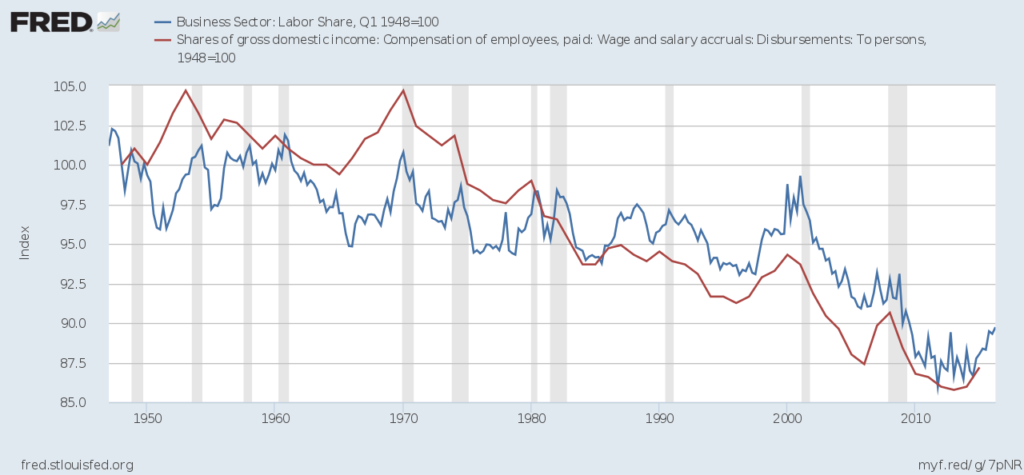
Ultimately, it doesn’t matter how productive the average worker is, because their employer takes all their production off them and gives only a fraction back, in the form of wages. This is inescapable given that the employer owns the workplace and everything that gets produced in it, and given that the Police will always take their side (at least initially) in any property or rights dispute.

In America, the labour share (or wage share) has been declining for several decades. Compared to the early 1970s, the labour share has declined some 10%. An OECD report suggests that a similar decline, of about 10%, has been seen in the labour share across a basket of Western countries. Employers take more, and give back less, than ever before.

To put this into perspective, the average American worker produces some USD72 of goods and services per hour of labour. A fall in labour share, from 65% to 55%, represents a $7.20 difference by the time it gets to the worker – and that’s before the other two lions take their share!

The second lion is taxes.

The average tax burden in Anglo countries is about 30%. This is lower than the average of other Western nations, and reflects that Anglo countries are run in accordance with a small-government ideology. However, it’s still a significant amount of the average worker’s productivity. After losing 45% of their productivity to profits, to lose a further 30% to taxes is brutal.

It means that our average worker, having produced $72 of goods and services before the lions took their share, is now down to about $27 after profits and taxes have been accounted for. The tax burdens of Taiwan, Hong Kong and Singapore, by contrast, are all less than 15%, despite that their wages and standards of living are similar to those of Anglo countries.

And there’s still the third lion to contend with – perhaps the hungriest of all. This third lion is rents.

The median monthly gross residential rent in the United States is now around $1,100 per month. Median rents in New Zealand are around the same level. Assuming that our average worker works 150 hours a month, dividing their rent by the number of hours worked gives us around $7 an hour. In other words, seven dollars of the income earned for every hour of labour the average worker performs goes to pay the rent.

Subtracting this from the $27 after profits and taxes means that the average American worker ends up with $20 out of every $72 they produce, once profits, taxes and rents have been taken out. If the labour share was still 65%, if the tax rate was 15% like in Far East Asia and if the average rents were at pre-Clown World levels (let’s say $600 per month), the average worker would be left with around $36 for every hour worked – almost twice as much as in reality.

Moreover, out of the $20 per hour the average worker gets in reality, they have to pay for a number of work-related expenses out of that. Transport to and from their job, work clothing, health insurance (if American) and the cost of any psychiatric medicine they might need would account for another $10 at least. They also need to save some of their wage for a house deposit if they aspire to ever be more than a rentcuck.

All of these facts tell us that, if the average Anglo worker in 2021 had the benefit of a pre-1970s labour share, Far East Asian tax levels and pre-Global Financial Crisis rent levels, they would have about three times as much disposable income as they actually do have in reality. Once the three lions have taken their share, there isn’t much left over for the average worker.

In summary, the three lions that take a share out of every worker’s wage, before the worker sees it, are profits, taxes and rents. If we could reduce these expenses to levels that exist elsewhere in space and time, we could triple the prosperity of the average worker.

*

If you enjoyed reading this essay/article, you can get a compilation of the Best VJMP Essays and Articles of 2019 from Amazon for Kindle or Amazon for CreateSpace (for international readers), or TradeMe (for Kiwis). A compilation of the Best VJMP Essays and Articles of 2018 and the Best VJMP Essays and Articles of 2017 are also available.

*

If you would like to support our work in other ways, please consider subscribing to our SubscribeStar fund. Even better, buy any one of our books!