In the (supposedly) fantasy world of George Orwell’s 1984, geopolitical life is divided into three major blocs.
The only one we see in the story world is Oceania, home of protagonist Winston Smith. This consists of Britain, the Americas, Southern Africa, Australia and Oceania. This bloc is always at peace with one of the two other blocs, and always at war with the other.
The other two blocs are Eurasia, which roughly means Europe plus all of Russia and parts of Central Asia, and Eastasia, which roughly means China, Japan, Korea and parts of South East Asia.
Inbetween each of the blocs is a contested zone that is essentially no-man’s land. In the story world of 1984 there is one such zone between Oceania and Eurasia, and one such zone between Oceania and Eastasia (there are others, but only the ones referring to Oceania are mentioned in the book).
1984 was published in 1949, almost three-quarters of a century ago. It has proven incredibly prescient, because if one looks around the world today it appears very similar to the then-future world described by Orwell.
Oceania is today’s Anglo-Judaic Empire, i.e. Britain and most of the former British Empire. Unlike in 1984, the Oceania equivalent today includes Japan and Korea.
Eurasia is today’s Russia. In 1984, Eurasia is Russia plus a conquered Europe. In today’s world, of course, Russia has shown little ability to conquer Europe. Perhaps they have the will, but the ability is another thing.
Eastasia is today’s China plus North Korea. In 1984, Eastasia included Japan, South Korea and some of South East Asia. At the moment, those areas are Oceanian territory. But if the Chinese waged a lightning war at some point in the future, they could conceivably take them over.
Already one combat zone is active on the border between Oceania and Eurasia (The European Union is effectively territory held by Oceania for now), in Ukraine. This zone might drift westward such that Oceania gets pushed back to the British Isles. If it did, it would be exactly like Orwell’s prediction.
Even if Orwell’s prediction wasn’t geographically accurate, it’s still temporally accurate. In 1984, it turns out that wars are supposed to go on forever, specifically because this wastes resources, because if resources are not wasted then people have time to think about their situation and that leads them to rebel against the government.
On the Oceania/Eurasia border in today’s world, Russia and Ukraine also seem to be fighting such a forever war. Even though Western countries are spending tens of billions on arming Ukraine, the front lines move very little. Both sides have been fighting over one town, Bakhmut, for seven months straight. So little has happened in 15 months, it’s easy to imagine the two might still be at war in 15 years.
This has complications for us, seeing as we are a de facto (if not de jure) American ally, and this makes us a potential target from China’s perspective. Being part of Oceania, we’re someone that Eastasia might bomb if we get drawn into conflict against each other.
The third combat zone appears to be be Iran and the Middle East. This one has also been brewing for a while, with John McCain and Hillary Clinton both cheerleading for bombing Iran to protect Israel. Iran’s development of nuclear weapons technology is a clear existential threat to their sworn enemies Israel, and both countries lie in the disputed area between the three blocs.
Other potential combat zones in the near future are India vs. China (in the Himalayas) or Ethiopia vs. Egypt and Sudan (over the Great Ethiopian Renaissance Dam). If some or all of these other combat zones became as hot as the ongoing War in Ukraine, our world would look extremely similar to Orwell’s prediction.
It’s necessary to note that Orwell didn’t really predict these things – he knew about them from what other members of the ruling class said to him, because it’s been a ruling class plan for a very long time. Going all the way back to Babylon, the ruling class has always dreamed of a system where they could divide and conquer the masses to such an extent that it was impossible to overthrow them.
This explains why Orwell was able to predict so accurately the world of 2023, with its three major blocs and an equatorial disputed zone.
Today we look at the aptly named Disinformation Project’s latest hit piece. The Disinformation Project, which can be accurately considered Establishment media, serves the same purpose as the other Establishment media: to set the bounds of acceptable discussion, and to smear the enemies of the ruling class. To that end, they run hit pieces on those enemies.
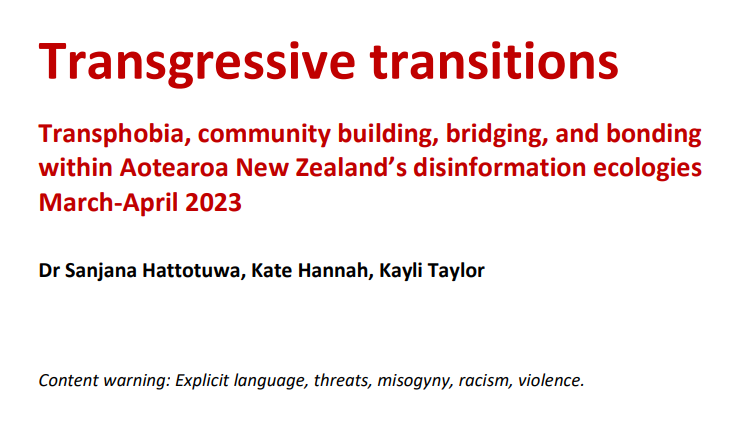
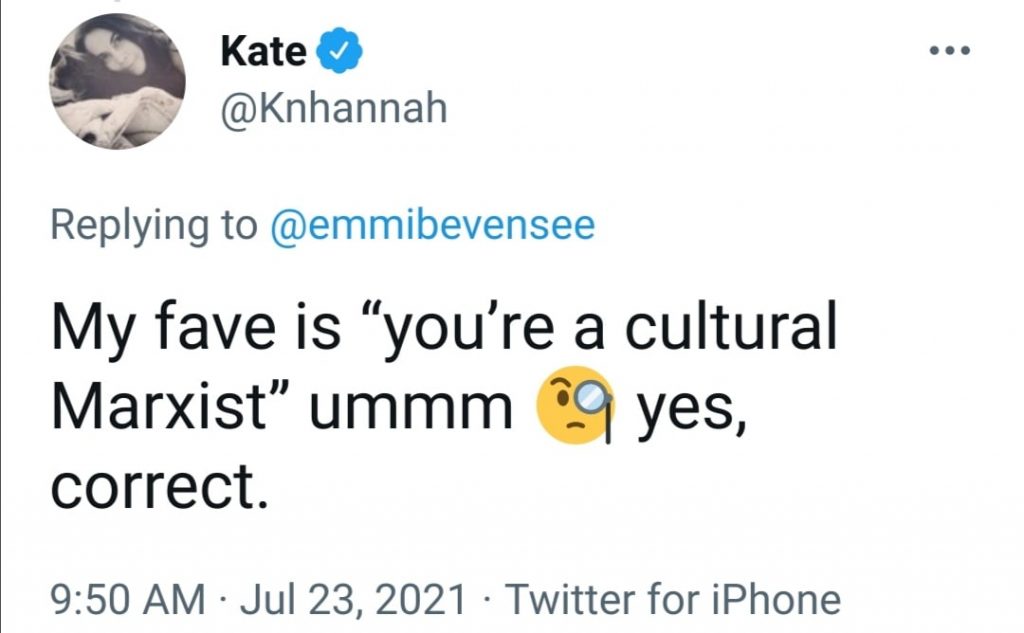
This time, the target was the “disinformation ecology” surrounding Posie Parker’s recent visit to Auckland. This analysis will explain how The Disinformation Project, spearheaded by admitted Marxist Kate Hannah, uses such terms to smear the reputations of those who dare criticise the Labour Government.
This report begins with the cringe-inducingly self-righteous declaration that The Disinformation Project has a legitimate interest in “observing, collating, categorising, and analysing open source publicly available data related to Covid-19 mis- and disinformation.” It’s like having a Ministry of Truth, but limited to the question of Covid-19.
Apparently, those who dissented from the Government’s Covid-19 narrative have now incorporated “more features of international far-right talking points – immigration, reproductive rights, LGBTQIA+ (and particularly trans rights), globalisation, nativism, loss of hegemony – alongside other, localised conspiratorial frames encompassing 1080 drops to co-governance.”
“Conspiratorialism” is a particular concern of theirs, for reasons not given. It’s just a way of smearing anyone who distrusts the Government as an unreasonably paranoid person. Andrew Little is fond of using the term “conspiracy theorist” to sully the reputation of anyone who thinks the Sixth Labour Government is lying about anything, and The Disinformation Project seems to have taken his lead.
In reality, anyone who doesn’t believe that any conspiracies are happening is stupid. Almost every historical event is preceded by multiple conspiracies. The settlement of New Zealand involved one conspiracy after another. Every war is conspiracy and counter-conspiracy until one side wins. The smarter someone is, the more conspiratorial they will be.
‘Transgressive transitions’ cites the theory of American social scientist Robert Putnam, but its authors don’t appear to be familiar with Putnam’s work as a whole. Putnam’s most cited work is titled ‘E Pluribus Unum‘, in which he established that “immigration and ethnic diversity tend to reduce social solidarity and social capital”. This was one of the first studies to demonstrate a statistically significant negative correlation between ethnic diversity and social trust.
Unfortunately for The Disinformation Project, the contention that ethnic diversity reduces social capital has been backed up by a meta-analysis of the science since Putnam’s article was written. So they find themselves mischaracterising concerns about immigration as an “international far-right talking point”, when such concerns are, in fact, backed up by mainstream science.
The Disinformation Project themselves spread disinformation – about nationalists, among others.
This report is notable for its obsessive belief in a “disinformation community”, which amounts to the same thing as their collective ideological enemies. These disinformation communities are primarily online spaces where people question the mainstream narrative. As Orwell put it: wrongthinkers.
Already by page 4 the authoritarian sentiments of the report’s authors are evident, as they rant about “dangerous speech”. Anti-free speech rhetoric is common among the authoritarian left – it was, after all, leftists who got Clown World Chronicles banned from TradeMe. The authoritarian left in New Zealand, as in the Soviet Union, correctly perceives free speech as a major threat to their attempts at narrative control.
Also by page 4 the authors manage to make clowns of themselves, linking anti-Covid sentiment to anti-Maori sentiment. Apparently they were not aware that some 30-40% of the Parliament Lawn protesters at any one time were Maori. Neither were they aware that Maori mothers, understandably concerned about the effects of an improperly tested vaccine on their children, have been one of the core dissident groups from the beginning.
Grandly, The Disinformation Project declares that it “now studies a diverse and dynamic disinformation ecosystem preoccupied with multiple and shifting ideological concerns” – i.e. the Deplorables, the bottom feeders, the Nazis. Anyone who questions the Government is now part of a disinformation ecosystem. The Disinformation Project – in their minds – are heroes fighting these trends on behalf of social cohesion.
The anti-white sentiments of the globalist leftist authors of this report are revealed when they make a determined effort to defend Marama Davidson for her racially abusive outburst to CounterSpin Media during the Posie Parker protests. They link to a propaganda piece from Establishment Left mouthpiece Radio New Zealand which defends Davidson and smears CounterSpin as “far-right”.
The authoritarian sentiments of the report’s authors are further revealed with their rant about Elon Musk that takes up most of page 7. This rant concludes with an accusation that Musk is guilty of “amplification of racism, and other harms” by engaging with accounts that promote, among other things, “disinformation”.
On page 8, this report claims that its observations are backed up by research from the Center for Countering Digital Hate. However, it has been noted elsewhere that the Center for Countering Digital Hate is a British Labour Party mouthpiece, with several of its high-ranking administrators also taking roles in the British Labour Party.
On page 9 the report’s authors further underline their authoritarian credentials by complaining that TeleGram is “unregulated”. Apparently the free speech approach of TeleGram has resulted in “a significant and immediate increase in the use of dangerous speech”. To the authoritarian left, it’s dangerous when people who are unregulated by the government presume to speak.
A multinational effort is being made to pressure TeleGram into banning political dissidents. Since 2021, some German politicians have demanded that TeleGram be banned if they do not submit to government censorship regarding permissible content matter. British political figures also spoke out against the platform. The anti-TeleGram rhetoric in The Disinformation Project’s report is just other example of this globalist anti-free speech trend.
The report then spends several pages crying about neo-Nazis. Again, we are left wondering if they are still talking about the same people as in the Parliament Lawn protests. The 30-40% Maori contingent were presumably not neo-Nazis, and neither were all the old hippie women who comprised at least another 25% of the protesters. So who are all these neo-Nazis? It’s never made clear. It’s just suggested that anyone anti-Establishment is a Nazi.
From there, the report spends a few pages complaining about dehumanising language – but there are few tropes more dehumanising that the one claiming that nationalism is inherently a philosophy of exclusion, and that anyone speaking for nationalism must be in favour of gas chambers full of Jews. This trope, typically pushed by the globalist authoritarian left, has had the effect of demonising and dehumanising all nationalists, as if to prefer one’s own kind was the preserve of bloodthirsty beasts.
Speaking of language, the language used in this report is usually of the bloated and pompous kind used by academics with little real-world experience. An example is the phrase “instrumentalization of stickers” where “use of stickers” would have conveyed the same information more efficiently.
It’s not obvious what purpose is served by complaining about sticker packs on TeleGram, as this report does at length. One suspects that The Disinformation Project is following the lead of America’s Anti-Defamation League, which catalogues every aspect of the online expression of people they hate and then links it somehow to far-right-wing extremism.
This is known elsewhere as the Censorship Industrial Complex. A similar concept to globohomo, the Censorship Industrial Complex refers to the alliance of Marxists and corporate whores who work together to silence true dissidents or freethinkers. The Disinformation Project is part of this complex, and their work (including this report) involves gaining support for the cancellation of their enemies.
Speaking the truth is now dangerous speech if it doesn’t suit The Agenda.
The report then spends several pages crying about GIFs and other memes, and how the spread of such memes can “formulate a norm-setting exercise”. Apparently there is such a thing called the “‘for the lulz’ tactic” and this is nefariously used to advance extremist ends. In the New New Zealand, a sense of humour is grounds for suspicion of wrongthink.
The Disinformation Project monitors 126 FaceBook pages “associated with disinformation narrative production and promotion”. These are contrasted with 84 mainstream media pages, which presumably never produce or promote falsehoods. This shameless cheerleading for the mainstream media further reveals The Disinformation Project’s pro-Establishment bias.
Apparently the Posie Parker visit and protests caused a remarkable uptick in the volume of “hate speech” directed against minorities and other vulnerable groups in New Zealand cyberspace. Hence The Disinformation’s Project’s concern. Christian lobbyists appear to have been particularly incensed at the time of the Parker visit.
The report goes on to state that questioning the validity of trans people is tantamount to “genocidality”. This further reveals authoritarian intent – ‘do what I tell you, else you’re a Nazi’.
On page 26, the authors start complaining about freethinkers on InstaGram. They discovered that “mis- and disinformation accounts studied on Instagram received higher engagement than accounts from mainstream media”, which is another way of saying that alternative media is more honest than the mainstream, and that this honesty drives the higher engagement.
Apparently there is a connection between the Parliament Lawn protesters and the pro-Parker protesters. This is cause for another neologism – “disinformation superspreaders”. This is a new term for high-ranking members of the alternative media who the Establishment would like to silence. The true connection between the Parliament Lawn protest and the Parker protest was that, in both cases, the Government lied about what was really going on. Hence, people flooded to the alternative media on both occasions.
To understand this is to understand the purpose of The Disinformation Project and even the mainstream media itself: to silence dissenters.
On page 29, the authors lament that “disinformation ecologies” are winning the battle for the public’s trust. At no point do they consider the obvious explanation for this: that the alternative media tells fewer lies. Moreover, much of the distrust of the mainstream media comes from their unwillingness to cover certain issues – issues that the alternative media has no problem covering.
Propaganda techniques that can be seen every day in the establishment media, such as “rage-baiting, performative outrage, emotional contagions, inflammatory presentations, aggrieved frames, and dangerous speech” are now “disinformation narrative techniques”, and we are asked to believe that only the alternative media performs them. To suggest that the establishment media does the same thing is to wrongthink.
The authors note on page 34 that the alternative media is not subject to the same decline of trust as the mainstream media. This is because the mainstream media does just as much rage-baiting, performative outrage and inflammatory presentation as the alternative media, if not more. People are no longer as gullible as in the 1950s, and have realised that media authorities are not moral authorities.
With a lack of irony befitting of the NKVD, the report goes on to complain of the “significant and growing implications for democracy and social cohesion” of people no longer trusting the mainstream media. What the authors of this report want is restrictions on the alternative media. But there wouldn’t even be an alternative media if the mainstream one didn’t tell lies and omit truths to suit the interests of their globalist owners.
The report repeats a delusion that is common among the New Zealand Left: that anti-Government, anti-authority or anti-the current thing sentiments are imported from America. They aren’t, and they don’t need to be. We’ve been part of the same global system as America for over 200 years. Anti-trans sentiments are growing because pro-trans sentiments are being pushed on people by globalists who intend to demoralise their subject populations.
On page 34, the report makes an obvious point: “It is possible that disinformation news, media, and information ecologies benefit from declining interest in mainstream journalism”. This is certainly true, but only if you replace “disinformation news, media and information ecologies” with ‘the alternative media’. If the mainstream anything goes bad – not just media – people will look for alternatives. The blame does not fall on the alternatives for providing a better product.
In the Conclusion section, this report rehashes Hillary Clinton’s long-debunked conspiracy theory that Russian propagandists are shaping the anti-Establishment sentiment in the West. Hilariously, it also warns of a “collective narcissism” among New Zealand’s alternative media, as if the camera-obsessed Hannah and Hattotuwa were any better.
The rest of the conclusion is spent in breathless hysteria trying to link all the anti-Establishment ideologies into one uber-conspiracy. Apparently “explicitly far-right content” has embedded itself in New Zealand cyberspace, and we have to stop it because it’s a threat to national security, as well as being a threat to social cohesion.
Ultimately, what The Disinformation Project is trying to do with this report is to build support for the banning or heavy restriction of all alternative narratives. To that end they demonise the alternative media, equating them with Nazis or other hated groups, in order to justify cancelling them. It’s shameless propagandising and disinformation-spreading, but that’s how the political establishment wages war against its domestic enemies today.
The New Conservative Party had one of the strongest Internet presences of any party leading up to the 2020 General Election. They regularly scored 5%+ in online polls of voting intent. In the actual election, however, they only got 42,613 votes, or 1.5% of the total. This was not enough to win any seats in Parliament.
Variable
Voting New Conservative in 2020
Voting Labour in 2020
0.13
Voting National in 2020
0.68
Voting Greens in 2020
-0.35
Voting ACT in 2020
0.68
Voting New Zealand First in 2020
0.29
Voting TOP in 2020
-0.05
Voting Maori Party in 2020
-0.57
Voting Advance NZ in 2020
0.12
Voting ALCP in 2020
-0.31
Voting Sustainable NZ in 2020
0.37
Voting Social Credit in 2020
0.35
Voting NZ Outdoors Party in 2020
0.34
Unsurprisingly, New Conservative voters were similar to National and ACT voters. The correlations between voting New Conservative in 2020 and voting National in 2020 or voting ACT in 2020 were both 0.68. This reflects that New Conservative is a right-wing party, competing for the same votes as National and ACT.
Although there was a significant positive correlation between voting New Conservative in 2020 and voting New Zealand First in 2020 (0.29), this was not as strong as any of the correlations between voting New Conservative in 2020 and voting Sustainable NZ in 2020 (0.37), voting Social Credit in 2020 (0.35) or voting NZ Outdoors Party in 2020 (0.34).
These positive correlations seem unlikely, given that New Conservative is right-wing and New Zealand First, Sustainable NZ, Social Credit and NZ Outdoors Party are all centrist/leftist. But they can be explained by the fact that all these parties appeal to the relatively disenfranchised, and hence they share demographics on that basis.
The strongest negative correlations were between voting New Conservative in 2020 and voting Maori Party in 2020 (-0.57), voting Vision NZ Party in 2020 (-0.42), voting Greens in 2020 (-0.35) or voting Aotearoa Legalise Cannabis Party in 2020 (-0.31).
These correlations are easy to explain: New Conservative voters tend to be old and white, whereas Maori Party, Vision NZ Party and ALCP voters tend to be young and brown, and Greens voters tend to be young.
Variable
Voting New Conservative in 2020
European
0.50
Maori
-0.44
Pacific Islander
-0.25
Asian
-0.21
The New Conservatives made a big deal about the racial diversity of their candidates, but their constituency was solidly white. As with the National and ACT parties, there was a significant positive correlation between being of European descent and voting New Conservative in 2020 (0.50).
The negative correlation between being a Pacific Islander and voting New Conservative in 2020 (-0.25) was much weaker than the correlations between being a Pacific Islander and voting either National in 2020 (-0.46) or ACT in 2020 (-0.58). This was mostly down to two major factors: the fact that then-Deputy Leader Elliot Ikilei was conspicuously Polynesian, and the fact that the New Conservatives in general were conspicuously Christian.
The strongest negative correlation between voting New Conservative and belonging to a particular race was with Maoris, at -0.44. This can be explained by the fact that Maoris, who tend to be younger and poorer than the rest of New Zealand, have little incentive to vote for the status quo.
Variable
Voting New Conservative in 2020
No religion
0.04
Buddhism
-0.24
Christianity
0.24
Hinduism
-0.21
Islam
-0.22
Judaism
-0.36
Maori religions
-0.38
Spiritualism and New Age
0.01
Maoris and Jews share very few things in common, but one thing they do share is a significant dislike for voting New Conservative in 2020. The correlation between voting New Conservative in 2020 and following one of the Maori religions was -0.38, and with being a Jew it was -0.36.
The only one religious group to have a positive correlation with voting for the New Conservative Party in 2020 was Christians, and even then the correlation was barely significant (0.24). The irony is that religious people, being conservative, tend to favour the status quo, and therefore they favour the status quo conservative party (National) and not the alternative conservative party (New Conservatives).
This means that the conspiciously Christian branding of the New Conservatives did little to win the votes of mainstream Christians. The Christian fringe, however, were significantly more likely to vote New Conservative in 2020 than vote for other parties.
Variable
Voting New Conservative in 2020
20-24 years old
-0.52
25-29 years old
-0.47
30-34 years old
-0.33
35-39 years old
-0.20
40-44 years old
0.01
45-49 years old
0.30
50-54 years old
0.46
55-59 years old
0.59
60-64 years old
0.63
65-69 years old
0.61
70-74 years old
0.64
75-79 years old
0.65
80-84 years old
0.65
85+ years old
0.54
Like most reactionary parties around the world, New Conservative voters were old. There was a significant positive correlation between voting New Conservative in 2020 and belonging to any age bracket above 45 years old. All of the age brackets between 60 and 84 years old had a positive correlation of at least 0.60 with voting New Conservative in 2020.
The correlation between voting New Conservative in 2020 and belonging to a particular age bracket became more and more positive as age increases, from the 20-24 age bracket (where it is -0.52) all the way up to the 60-64 age bracket (where it is 0.63). Older age brackets were consistently strong supporters of New Conservative.
The obvious reason for this is that young people don’t like conservatism. They are much less likely to own homes or to earn a wage that they can one day buy a home with. As such, they are not incentivised to support the status quo. Moreover, young people are much less likely to be Christian.
Variable
Voting New Conservative in 2020
Being male
0.09
The correlation between voting New Conservative in 2020 and being male was not significant, at 0.09. This was however the third highest proportion of male voters of all parties. Only voting Heartland NZ in 2020 (0.11) and voting Outdoors NZ in 2020 (0.22) had stronger positive correlations with being male.
This accords with data from other countries, where conservative parties regularly get a higher proportion of male voters. This is usually because male voters tend to have higher incomes, but this is not the case for New Conservative voters. This is further evidence that New Conservative voters were motivated by social conservatism more than economic conservatism.
Variable
Voting New Conservative in 2020
Median income
-0.19
Mean income
-0.27
One major way in which New Conservative voters differ from National and ACT voters is income. There is a significant positive correlation between mean income and voting either National or ACT in 2020, but a significant negative correlation between mean income and voting New Conservative in 2020.
This suggests a paradox: New Conservative voters vote for the right-wing, which usually favours those with money, despite that New Conservative voters don’t have much money themselves. This paradox can be resolved by referencing the fact that New Conservative voters tend to be religious and so, like low-income Americans who vote for right-wing parties, they tend to be values voters.
Variable
Voting New Conservative 2020
Not studying
0.63
Wage or salary
-0.45
Interest, dividends, rent or other investments
0.29
NZ Super or Veteran’s pension
0.65
Student Allowance
-0.48
New Conservative voters might not have a high income (the correlation between voting New Conservative in 2020 and mean income was -0.27), but they are comfortable and secure by many measures. For example, there was a significant positive correlation between voting New Conservative in 2020 and receiving NZ Super or a Veteran’s pension (0.65) or receiving income through interest, dividends, rent or other investments (0.29).
By contrast, there was a strong negative correlation between voting New Conservative in 2020 and receiving a wage or salary (-0.45). This wasn’t because students vote for them either: there was a correlation of 0.63 between voting New Conservative in 2020 and not studying, and also a significant negative correlation of -0.48 between voting New Conservative in 2020 and being on the Student Allowance.
It seems that New Conservative is, to a large extent, a pensioner’s party. They seem to attract many of the conservative old people who are more Christian, rather than the more ethnonationalist, who tend to prefer New Zealand First.
Variable
Voting New Conservative 2020
Own or part own house
0.71
Neither own house nor family trust
-0.71
New Conservative voters were very likely to own their own homes – the correlation between voting for them in 2020 and owning or part-owning a house was 0.71. In this sense, New Conservative voters also suffer from the “too much time on the Internet” phenomenon that affected Advance NZ voters. This explains why both parties got so few votes in comparison to the size of their Internet presence.
The correlation between receiving NZ Super or a Veteran’s Pension and owning or part-owning a house was 0.79, one of the strongest correlations in the whole Understanding New Zealand dataset. This explains why New Conservative voters tend to own their own houses despite being low-income.
Variable
Voting New Conservative in 2020
No qualifications
0.24
Level 1 certificate
0.40
Level 2 certificate
0.25
Level 3 certificate
-0.55
Level 4 certificate
0.35
Level 5 diploma
0.37
Level 6 diploma
0.55
Bachelor’s degree
-0.31
Honours degree
-0.26
Master’s degree
-0.35
Doctorate
-0.25
As with Advance NZ, there was a significant negative correlation between voting New Conservative in 2020 and having any of the university degrees. These negative correlations were not as strong as they were for Advance NZ, however.
The most likely to vote New Conservative in 2020 were those with a level 6 diploma – the correlation here was 0.55. The reason for this is the strong support for the New Conservatives among tradesmen who have completed training at polytechnic – the correlation between voting New Conservative in 2020 and being a technician or trades worker was 0.52.
That New Conservative voters might be poorly educated is not a surprise to those who have observed similar Christian fundamentalist movements in other countries. The New Conservative’s message was primarily based on fear, and fear-based messaging primarily appeals to the poorly educated. This explains the constant hysteria about homosexuality and cannabis use.
Variable
Voting New Conservative in 2020
Working in agriculture, forestry or fishing
0.34
Working in mining
0.17
Working in manufacturing
0.24
Working in electricity, gas, water or wastewater
0.14
Working in construction
0.37
Working in wholesale trade
0.05
Working in retail trade
0.35
Working in accommodation or food services
-0.32
Working in transport, postal or warehousing
-0.25
Working in information media and telecommunications
-0.46
Working in financial and insurance services
-0.31
Working in rental, hiring and real estate services
0.06
Working in professional, scientific and technical services
-0.29
Working in administrative and support services
-0.46
Working in public administration and safety
-0.24
Working in education and training
-0.23
Working in healthcare and social assistance
0.11
Working in arts and recreation services
-0.35
Fittingly, then, the party was heavily represented among those working in masculine industries.
There was a significant positive correlation between voting New Conservative in 2020 and working in construction (0.37) or working in agriculture, forestry and fishing (0.34). There was also a significant negative correlation between voting New Conservative in 2020 and working in administrative and support services (-0.46), being a community and personal service worker (-0.31) or working in public administration and safety (-0.24).
These correlations don’t reflect the relatively poor educational levels of New Conservative voters so much as they reflect a particularly object-orientated social approach. New Conservative voters appear to be disinclined towards working with people, and prefer working with things. This is typical for masculine groups.
Variable
Voting New Conservative in 2020
Working as a manager
0.36
Working as a professional
-0.33
Working as a technician or trades worker
0.52
Working as a community or personal services worker
-0.31
Working as clerical or administrative worker
-0.01
Working as a sales worker
-0.09
Working as a machinery operator or driver
0.02
Working as a labourer
0.07
The occupation in which one is least likely to find a New Conservative voter is professional. The correlation between voting New Conservative in 2020 and being a professional was significantly negative, at -0.33. This reflects multiple factors, but in particular the poor education of New Conservative voters.
The correlation between voting New Conservative in 2020 and working as a manager was significantly positive, at 0.36. This is primarily a function of two things. One, managers tend to be older than average, like New Conservative voters. Two, managers don’t need to be well-educated to perform in their roles, just committed.
Some might be suprised to read that the correlation between voting New Conservative in 2020 and working as a technician or trades worker (0.52) was so much stronger than the correlations between voting that was and working as as machinery operator or driver (0.02) or as a labourer (0.07) were much weaker.
This can be explained by age. New Conservative voters, as discussed above, tend to be old. Few old people can cut it as labourers, or even as machinery operators and drivers. But there are many old people working as technicians or trades workers. The trades are well-known for appealing to youngsters on account of that many of their workers will soon retire.
Variable
Voting New Conservative 2020
Has no children
-0.54
Has one child
-0.21
Has two children
0.65
Has three children
0.61
Has four children
0.26
Has five children
-0.07
Has six or more children
-0.24
The correlations between voting New Conservative in 2020 and having children are the strongest for having two children (0.65) or having three children (0.61). This is not surprising given the age of New Conservative voters. Those who have no children, or only one, tend to be much younger and less religious.
Being mostly white, New Conservative voters are significantly less likely to have six or more children. The correlation between voting New Conservative in 2020 and having six or more children was -0.24. The correlation between voting National in 2020 and having six or more children was, however, -0.59, so New Conservative voters are relatively fecund by that measure.
In summary, New Conservative voters represent a kind of old-school masculinity that perhaps hasn’t adjusted well to changing times. This is best shown by the strong negative correlation of -0.66 between voting New Conservative in 2020 and casting a special vote for Yes in the cannabis referendum.
New Conservative voters tend to be old, white, male, poorly educated and Christian. As such, they are very much the same demographic targeted by the American Republican Party in their “Southern Strategy”. Such voters are not as numerous in New Zealand as in America, but there might still be enough of them to get New Conservative over the 5% in 2023.
*
This article is an excerpt from the upcoming 3rd Edition of Understanding New Zealand, by Dan McGlashan and published by VJM Publishing. Understanding New Zealand is the comprehensive guide to the demographics and voting patterns of the New Zealand people.
Many New Zealanders were pleased by the recent news that Kiwis living in Australia will be able to apply for citizenship after four years. This marks a significant change from the status quo, under which a Kiwi could live in Australia for 20 years without being able to vote or access healthcare. Few realise, though, that the move is another step towards federalisation.
The last time I travelled overseas was some years ago. While in the Auckland Airport departure lounge, I saw some t-shirts for sale that said simply “Yeah nah”. This phrase – yeah nah – is seldom used in Britain or North America and is therefore an iconic expression of Kiwi culture. Or so I thought.
The next leg of the journey saw me in the Sydney Airport departure lounge, where they were also selling t-shirts that said “Yeah nah”. It turned out that this phrase is used so frequently in Australia that it’s considered by Australians to be an iconic expression of their culture.
New Zealand culture is Australasian culture. There are aspects of culture that are unique to New Zealand and not shared with Australia, but those are as minor as the aspects of culture unique to, say, California and not shared with Ohio. For the most part, idiosyncracies that Kiwis consider uniquely Kiwi are in fact shared across Australasia.
These idiosyncracies are set to become even more shared with the new citizenship protocols. Until now, Kiwis had endured a kind of second-class status with several restrictions. Now they will be first-class citizens after only four years – a privilege not afforded to most nationalities, who will have to slog through the permanent residency process.
Some have complained that the new Australian citizenship rules will lead to an intensification of the brain drain from New Zealand. This is probably true. Some claim that this will lead to the Third Worldification of New Zealand as our productive workforce all leaves for higher wages. This is possibly true – but it depends on the future of Trans-Tasman relations.
The new citizenship rules will reduce the legal distinctions between Australian and New Zealand citizens. Eventually people will ask themselves: if Kiwis can freely move to Aussie and can become citizens with a minimum of effort, and vice-versa for Aussies, why even bother having separate systems? Why not just become one Anzac Republic – Anzacistan?
It’s already the case that many young Kiwis studying in New Zealand intend to move to Australia as soon as they are qualified. This is fine from Australia’s point of view, as they get educated additions to their workforce. It’s very bad from New Zealand’s point of view, as their taxpayers pay for 13-18 years’ education only to not get any benefit from the greater productivity.
If New Zealand became a state of Australia, it would mean that Australian tax money also be used to pay for the education of Kiwis. No longer would Kiwi taxpayers fund the Australian workforce to their own detriment. If the Third Worldification of New Zealand can be prevented through federalisation, then both sides would be foolish not to agree to it, given the strategic considerations of New Zealand’s impoverishment.
Such a move is possibly inevitable anyway, given that we are only separate countries due to a historical fluke: The Mistake of 1901. The decision to even be separate countries in the first place was the result of erroneous thinking, in particular the belief that the 2,000km between New Zealand and Australia represented a vast gulf, akin to the distance between Italy and Tunisia.
In reality, the cultural difference between New Zealand and Australia is minuscule. A person can fly from Christchurch to Perth, a distance of over 5,000km, and will find most things in their new city familiar. Dress, mannerisms, architecture, popular brands and culture: all very similar. They can even find a thriving rugby union scene.
Few countries in the world have this degree of cultural homogeneity among regions at their opposite ends. Yet Australia and New Zealand have this, and are not one country. Why? Without referring to The Mistake of 1901, no logical explanation can be given. It seems to have been assumed that we would grow apart, like England and Ireland perhaps, but instead we grew together.
It’s time to accept that our forefathers, who predicted divergent evolution, were wrong. The cultures and peoples of New Zealand and Australia have, in fact, evolved convergently over the last 120 years. To understand this is to accept that federalisation is inevitable.
There are already some 670,000 Kiwis living in Australia. Now that this cohort can easily access Australian citizenship, and given that dual Kiwi-Aussie citizenship is already possible, the thin dividing lines between Kiwis and Aussies will get even thinner.
If federalisation is inevitable, it’s time to stop worrying about what rights Kiwis should have in Australia, and it’s time to start worrying about the terms under which New Zealand would accede to Australian statehood.