The case of Baby Will has received international attention in recent weeks. Will needed heart surgery and his parents, quite reasonably, requested that the surgeons use blood that did not contain a Covid vaccine. The logic of Will’s parents was that the Covid vaccines have not been adequately tested, and therefore are not safe to put into an infant. The Government disagreed.
The Government’s position, as it always is, is that the Government decides what you’re allowed to do and not allowed to do. It doesn’t matter if you’re the one that ends up suffering from getting it wrong. It doesn’t matter if you’ve got a postgraduate degree in the topic under discussion. Might makes right, and the Government has the might, therefore the Government is right.
The Government didn’t want Baby Will to be given unvaccinated blood. No official reason was given, but from unofficial statements it appears their chief concern was the logistical expense and hassle of needing to give unvaccinated blood to everyone who wanted it. As is often the case, the Government was reluctant to treat people humanely in case it set a precedent that they would be expected to live up to.
However, there was an impasse. Will’s heart surgery was urgent. Any delay waiting for official permission to use unvaccinated blood risked his death.
Rather than accede to the parents’ request, the Government uplifted Baby Will, sending Police officers in to rip him out of his mother’s arms. The surgery was performed with vaccinated blood, and Will was returned to his parents. As far as the Government is concerned, the story ends there. But questions remain.
If Baby Will had been given vaccinated blood, and if this blood turned out to have been harmful on account of that the vaccine had not been properly tested, and thereby may have had unexpected side-effects, the Government would have taken no responsibility for any of it. But Will’s parents – and Will – would be the ones who had to wear the consequences.
All the hypotheticals reduce to one question: whose baby is it anyway?
In the ancient Roman pater familias system, the fathers of the family exercised absolute control over the individual members. Not only did those fathers have the legal right to kill members of their own family, they were even obliged to in some cases, such as obvious deformities. Life was cheap in the ancient world.
Today we don’t have the same resource scarcity that Ancient Rome did. There is no longer a fear that feeding deformed children will lead to famine. So now we have a compromise position. The popular opinion today is that parents may exercise authority over their children, subject to certain exclusions that are widely agreed to cause harm.
Difficulty arises when it comes to areas where the existence of harm is not widely agreed upon. The real question is who gets to decide, in these edge cases, what constitutes harm. Like so many social issues, this question tends to break down into two sides: one authoritarian and the other libertarian.
The authoritarian position is that the Government should get to decide. In the case of Will, that means that the Government decides whether Covid-vaccinated blood is safe or not.
The libertarian position is, of course, that the parents, having the closest kinship bond with the child, ought to decide. It is the parents who will end up suffering the most if the Covid-vaccinated blood kills the child or not.
Unfortunately, the authoritarian side of social issues is in the ascendancy thanks to various recent outcomes like the cannabis referendum. With that referendum, a narrow majority of us said, yes, the Government can lock us up if we presume to decide for ourselves what goes into our own bodies. Because of outcomes like this, and others, the authoritarians within the Government have become emboldened.
As a result of the weak pro-freedom sentiments among Kiwis, the Government has seen fit to override the wishes of Will’s parents, reasoning that the New Zealand population will accept such authoritarianism. And we mostly have. The authoritarians in the New Zealand public howled for Will to be taken away and his parents prosecuted. So far, there have been no prosecutions, but a precedent has been set.
A predictable risk for the New Zealand people is that the same logic is next used for gender reassignment surgery. Globohomo likes to make the argument that denying gender reassignment surgery is risking that the trans person commit suicide. So in the eyes of the Government, denying gender reassignment surgery can carry a similar degree of risk to delaying Will’s surgery. And they were willing to uplift a baby over that.
Being torn away from one’s parents is one of the most traumatic experiences a child can go through. In order to justify it, the Government has to have excellent reason to believe that they’re preventing significant harm. In the case of Baby Will, the only potential for harm came from the Government itself. As such, they are very much the bad guys in this story.
For many people – especially Germans – nationalism is equated with right-wing politics. We are told that nationalism is necessarily ethnosupremacist, and that nationalists must necessarily hate and want to destroy outsiders. Like most aspects of the popular narrative, this is total bullshit. This essay explains.
Following their victory in World War II, Communist forces realised that they could silence all of their enemies by calling them Nazis. So they did. Anyone opposing the globalist left – whether nationalist right, nationalist left or globalist left – was called a Nazi, and hounded into silence.
When those same Communists completed their Long March Through the Institutions at the turn of the century, and took control of the mainstream political narrative, the Communist weltanschauung was normalised, to the exclusion of all others. By today, we’re expected to believe that the left wing are inherently globalist and that the right wing are inherently nationalist.
The truth is more like the following:
The globalism vs. nationalism axis and the right vs. left axis are orthogonal. So it’s entirely possible to have left-wing nationalists and right-wing globalists. Having one Nazi/Commie right-wing nationalist/left-wing globalist axis only tells half of the story.
Nationalism comes from the word ‘nation’, which is a cognate with ‘natural’, ‘nativity’ and ‘nature’. It refers to the fact that, as tribes expanded beyond provinces, they came to organise themselves as nations, so that it was possible to speak of French, English, German, Russian etc. nations.
A nation, then, is the natural organisational model of a people.
Like everything else natural, a nation has a masculine, yang aspect and a feminine, yin aspect. In microcosm, this is reflected in the way that families have a father and a mother. Analogous to parents, there is a right-wing nationalism that reflects nationalist approaches to masculinity, and a left-wing nationalism that reflects nationalist approaches to femininity.
Right-wing nationalism, then, is about being a father for the nation. In the same way that the father of a family protects that family from external threats, and gathers the resources that family needs to survive, right-wing nationalism is primarily concerned with defence, immigration and economics.
That right-wing nationalists have a reputation for opposing mass immigration is not surprising. The father of the family is the one tasked with keeping dangerous outsiders away from the family home, and, by analogy, the right-wing nationalists are tasked with keeping dangerous outsiders away from the national home.
Left-wing nationalism, by contrast, is about being a mother for the nation. So in the same way that the mother of a family creates and nurtures the next generation, left-wing nationalism is primarily concerned with education, health and housing.
Taxation is not a concern for left-wing nationalists. Right-wing nationalists don’t like paying taxes, reasoning that it’s better for families to learn how to be self-reliant. But left-wing nationalists are happy to crank taxes up, reasoning that the children of the nation need taking care of now.
In any case, whether right-wing or left-wing, nationalism is the natural form of governance.
Globalism is an unnatural form of governance. Only in the case of empire does a person become subject to decisions made by others who are neither blood nor language kin. Indeed, it can be argued that globalist consciousness is inevitably the enemy of the natural, nationalist, consciousness.
Right-wing globalism is about plundering and exploiting the nations in the service of international capital. Right-wing globalists want low corporate taxes, few regulations and reduced barriers to the flow of international capital and labour. The more immigration, the higher the house prices and the lower the labour costs, so the greater the bank profits.
Modern slavery was created by right-wing globalists looking for people to exploit for profit. The transatlantic slave trade, involving African slaves, Jewish merchants and white plantation owners, was one of the first major globalist enterprises. The East India Company was another famous one. Both were concerned primarily with maximising return to shareholders.
Left-wing globalism is about plundering and exploiting the nation in the service of international communism. So the left-wing globalists will demand that the nations burden themselves with refugees, and will demand that local workers be taxed to pay for it. They will constantly push for refugee resettlement and foreign aid.
The left-wing globalists don’t use economic arguments to convince nations to take in foreigners, but rather moral ones. Much like Christians (their fellows in slave morality) left-wing globalists heap shame on those unwilling to accept their logic. Anyone who doesn’t want the refugee quota is labelled cruel and callous. The fact that people already in the country need resources is of no matter to the left-wing globalist.
What both right-wing and left-wing globalists agree on is importing foreigners. This always serves globalist interests because foreigners only rarely have true solidarity with their host nations, and so mass immigration reliably weakens national consciousness, and weakening national consciousness makes it more difficult for nations to organise to resist globalist depredation.
Nationalists don’t actually have a problem with foreigners in general, any more than someone who cares about his family has a problem with people outside his family. They merely demand that the foreigners that do come provide a net benefit to their host nation. In practice, this primarily means: no cheap labour driving down working-class wages and driving up working-class housing.
In summary, it’s entirely possible for a left-wing person to call themselves a nationalist, and to oppose both right-wing and left-wing globalism. Understanding this requires that people look past the crude Nazi vs. Commie narrative and realise that globalism vs. nationalism is the true political struggle of our times.
The ACT Party won a mere 13,075 votes in 2017, barely more than the joke parties. But in 2020 it won 219,031 votes. This 16-fold increase radically changed the composition of the ACT voting demographic.
Variable
Voting ACT 2020
Voting ACT 2017
European
0.74
0.16
Maori
-0.58
-0.51
Pacific Islander
-0.58
-0.23
Asian
-0.20
0.46
The main reason for the massive increase in ACT support from 2017 to 2020 was wealthy, old white people abandoning the National Party, but not abandoning the right wing. The correlation between being of European descent and voting ACT in 2017 was not significant, at 0.17. By 2020 this correlation had leapt to 0.74, which means that ACT now has the whitest supporters of any registered party, even whiter than New Conservatives.
Maoris were heavily disinclined to vote ACT in 2017 as well as 2020, and in 2020 the correlation between being a Pacific Islander and voting ACT was -0.51. This reflects the extent to which ACT policy disfavours the impoverished. Generally speaking, ACT appeals most to wealthy people who don’t want to be taxed.
Variable
Voting ACT 2020
Voting ACT 2017
Voting Labour same year
-0.12
-0.62
Voting National same year
0.92
0.61
Voting Greens same year
-0.08
0.17
Voting New Zealand First same year
0.18
-0.34
Voting Maori Party same year
-0.64
-0.42
Voting ALCP same year
-0.48
-0.52
Voting The Opportunities Party same year
0.18
0.03
Voting New Conservative/Conservative same year
0.68
0.04
That these new voters came predominantly from National is apparent when one looks at the strength of the correlation between voting National in 2020 and voting ACT in 2020: 0.92. This is much stronger than in 2017, when it was 0.61, or 2014, when it was 0.40. In 2020, ACT voters and National voters were from extremely similar demographics.
In fact, the correlation between voting ACT in 2020 and voting National in 2020 is so strong that the two voting demographics are close to identical. There were also strong correlations between voting ACT in 2020 and voting for the other parties whose demographics are wealthy, old and white (i.e. enfranchised), such as New Conservative (0.68) and Sustainable NZ (0.54).
Unsurprisingly, then, there were strong negative correlations between voting ACT and voting for the young, poor and brown parties, such as the Maori Party (-0.64) Vision NZ (-0.60) and ALCP (-0.48).
Variable
Voting ACT 2020
Voting ACT 2017
Aged 20-24
-0.51
0.18*
Aged 25-29
-0.44
0.18*
Aged 30-34
-0.34
0.36**
Aged 35-39
-0.22
0.36**
Aged 40-44
0.15
0.36**
Aged 45-49
0.58
0.36**
Aged 50-54
0.73
0.17***
Aged 55-59
0.78
0.17***
Aged 60-64
0.79
0.17***
Aged 65-69
0.77
0.11****
Aged 70-74
0.76
0.11****
Aged 75-79
0.74
0.11****
Aged 80-84
0.68
0.11****
Aged 85+
0.63
0.11****
The ACT Party also got much older in 2020. In 2014, the correlation between median age and voting ACT was 0.02. By 2017, it had increased to 0.26. By 2020, it had increased to 0.54 – stronger than the correlation between median age and voting National that year.
Most notably, the correlation between voting ACT in 2017 and being aged 65+ was 0.11, but the correlations between voting ACT in 2020 and belonging to any age bracket above 65 were all at least 0.63. The ACT demographic of today is much, much older than the demographic of even a few years back. Whether this reflects a permanent shift or just a temporary change in sentiments remains to be seen.
Variable
Voting ACT 2020
Voting ACT 2017
No qualifications
-0.12
-0.73
Level 1 certificate
0.20
-0.59
Level 2 certificate
0.05
-0.50
Level 3 certificate
-0.66
0.25*
Level 4 certificate
0.09
0.25*
Level 5 diploma
0.02
0.50**
Level 6 diploma
0.79
0.50**
Bachelor’s degree
0.03
0.70
Honours degree
0.16
0.58
Master’s degree
0.03
0.65
Doctorate
0.11
0.51
The easy assumption up until now was that the ACT Party appealed to a younger, more educated and more liberal demographic than National. This assumption used to be accurate, but by 2020 it no longer was. The ACT Party got so many votes from core National supporters that the two voting blocs are barely distinguishable when it comes to age, race, education or wealth.
By 2020, the average ACT voter was not significantly more likely than the average person to hold a university degree. This was a massive change from 2017. The correlation between holding a bachelor’s degree and voting ACT collapsed from 2017 (when it was 0.70) to 2020 (when it was 0.03). The correlations for other degrees fell by lesser, but still large, amounts.
In 2017 it was highly unlikely that a person with no NZQA qualifications would vote ACT – the correlation between the two was -0.73. But by 2020 that correlation had come in to -0.12. 2017’s ACT was heavily disproportionately supported by educated people. 2020’s ACT was much closer to broadly representative of the various education levels.
Variable
Voting ACT 2020
Voting ACT 2017
Living in an urban electorate
-0.23
0.37
One of the main reasons for the increase in ACT support from 2017 to 2020 was their support of firearms rights. Many of the new ACT voters were rural firearms enthusiasts. This is evident from the fact that the correlation between living in an urban electorate and voting ACT switched from a significantly positive correlation in 2017 (0.37) to a borderline significantly negative correlation of -0.23 in 2020.
Variable
Voting ACT 2020
Working in agriculture, forestry or fishing
0.43
Working in mining
0.20
Working in manufacturing
-0.15
Working in electricity, gas, water and waste services
-0.10
Working in construction
0.11
Working in wholesale trade
-0.05
Working in retail trade
0.03
Working in accommodation and food services
-0.08
Working in transport, postal and warehousing
-0.58
Working in information media and telecommunications
-0.21
Working in financial and insurance services
-0.04
Working in rental, hiring and real estate services
0.47
Working in professional, scientific and technical services
0.06
Working in administrative and support services
-0.65
Working in public administration and safety
-0.22
Working in education and training
-0.15
Working in healthcare and social assistance
-0.07
Working in arts and recreation services
0.01
Fitting with the high level of rural support for ACT are the significant positive correlations of 0.39 between voting ACT in 2020 and voting Outdoors NZ Party in 2020, and of 0.43 between voting ACT in 2020 and working in agriculture, forestry or fishing. There were also positive correlations, if not significant ones, between voting ACT in 2020 and working in mining or construction.
The most striking correlation here is the one of -0.65 between voting ACT in 2020 and working in administration and support services. This might surprise many, because ACT voters are so urbanised that one could expect heavy representation in industries that are typically urban, such as any office work.
The explanation is that ACT appeals mostly to those willing to take financial risks and to gamble, and so they tend to choose more entreprenurial industries. The choice of administration and support services is usually made by those who like to play it safe.
It is striking that such a strongly historically urban party as ACT might get more support from rural electorates in 2020 than urban ones. This speaks to the sense of betrayal that the right-leaning firearms community felt about National supporting restrictive firearms legislation. Almost all of these new, rural ACT voters will have been National voters in the previous election.
In several ways, the correlations between belonging to certain demographic categories and voting either ACT or National in 2020 are identical. Voting for either party had a correlation of 0.17 with casting a special vote for Yes in the euthanasia referendum, one of 0.58 with being aged 45-49 years old, one of -0.60 with voting for Vision NZ in 2020, and one of 0.68 with voting for the New Conservative Party in 2020.
Although the two parties have many shared sentiments, they have slight differences in some other ways.
Variable
Voting ACT 2020
Voting ACT 2017
Voting National 2020
Median income
0.20
0.61
0.23
Mean income
0.23
n/a
0.24
Median age
0.54
0.26
0.42
Mean age
0.53
n/a
0.39
Measured by income, the average ACT voter in 2020 was about as wealthy as the average National voter in 2020. This was a sharp movement towards the middle for the average ACT voter. In 2017, the correlation between voting ACT and median income was 0.61. By 2020 it had fallen so far that it was no longer significant.
The median age of an ACT voter, by contrast, increased sharply between 2017 and 2020. In 2017 the correlation between median age and voting ACT was barely significant, at 0.26. By 2020 this correlation was much stronger, at 0.54. In fact, this correlation was so strong by 2020 that it was stronger than the one between median age and voting National.
If National is an old person’s party, that’s now even more true of ACT. This marks a striking change from the young professional image that ACT usually projects.
Variable
Voting ACT 2020
Voting ACT 2017
New Zealand-born
-0.01
-0.56
In stark contrast to earlier years, when it was possible to write of ACT that they had the lowest proportion of New Zealand-born voters of any party, the correlation between voting ACT in 2020 and being New Zealand-born was -0.01. This is because the vast majority of their new voters were elderly and rural, and those demographics tend to be New Zealand-born.
These Kiwis did not come to favour ACT for nationalist reasons, however. Most of their sentiments were driven by anger over the incompetence of both Labour and National, who both supported heavy restrictions on firearms rights in the wake of the Christchurch mosque shooting. In the wake of these restrictions, ACT gained heavily from the perception of being a libertarian party.
Variable
Voting ACT 2020
Voting National 2020
Voting ACT 2017
Employed full-time
0.01
0.04
0.22
Employed part-time
0.50
0.27
0.07
Unemployed
-0.84
-0.82
-0.42
One notable difference between National and ACT voters is that the former are less likely to be employed part-time. The correlation between voting National in 2020 and being employed part-time was 0.27 – for voting ACT in 2020 it was 0.50. This speaks to the degree to which the ACT voters of 2020 value community engagement – in stark contrast to earlier years.
This also reflects the fact that ACT voters were much older in 2020 than in 2017, as older people frequently cut down from full-time to part-time work in their 50s and 60s rather than become unemployed or retired. So if a demographic has a strong positive correlation with working part-time, that demographic is probably full of the sort of person who volunteers for the Rotary Club or similar institutions.
However, the essential aspirationism of the average ACT voter is as strong as ever. The correlation between voting ACT in 2020 and being unemployed was -0.84, one of the strongest negative correlations in this study. ACT voters are definitely not the sit-on-the-couch type, even less than National voters are.
Variable
Voting ACT 2020
Voting National 2020
Voting ACT 2017
Work as manager
0.81
0.78
0.39
Work as professional
0.00
0.09
0.53
Work as technician or trades worker
0.08
0.05
-0.43
Work as community or personal service worker
-0.46
-0.61
-0.44
Work as clerical or administrative worker
-0.23
-0.01
0.05
Work as sales worker
-0.38
-0.18
0.06
Work as machinery operator or driver
-0.43
-0.43
-0.71
Work as labourer
-0.14
-0.29
-0.60
In 2017, ACT appealed roughly equally to managers and professionals. The correlation between working as either and voting ACT that year was significant but not particularly strong. By 2020, there was no longer any significant correlation between voting ACT and working as a professional. The correlation between voting ACT and working as a manager, on the other hand, become one of the most strongly positive correlations of any ACT supporter: 0.81.
The changes in ACT support from 2017 to 2020 reflect that much of their new support came from the sort of person who would be most interested in firearms rights. Occupations such as technician or trades worker, machinery operator or driver and labourer are typical among the firearms enthusiast community, and the correlations between all three and voting ACT became much less negative between 2017 and 2020.
Congruent with the perception that ACT voters tend to lack empathy, few ACT voters work as community or personal service workers. The correlation between working in this occupation and voting ACT in 2020 was -0.46. Votes from this demographic tend to go to the Labour Party.
Variable
Voting ACT 2020
Voting ACT 2017
No religion
0.37
0.07
Buddhism
-0.12
0.55
Christianity not further defined
-0.03
-0.12
Hinduism
-0.36
0.12
Islam
-0.39
0.10
Judaism
0.14
0.71
Maori religions
-0.49
-0.47
Spiritualism and New Age
0.05
-0.22
There was also a religious component to the pattern of ACT votes.
The correlation between having no religion and voting ACT in 2020 (0.37) was notably stronger than the correlation between having no religion and voting National in 2020 (0.16). ACT voters are less likely to be Hindus or Muslims by a similar margin. This speaks to how National has always pandered to Establishment religious sentiments whereas ACT has not.
In 2017, when ACT was a much smaller party, its voters were much more likely to be educated. This explains the strong correlations between voting ACT that year and being a Buddhist (0.55) or being a Jew (0.71), as those are two of the best-educated demographics in the country. By 2020, being a Buddhist or a Jew was much less likely to predict support for ACT.
Realistically, any party that moves from the fringe to significant electoral success will move towards the centre in most demographic measures. This is evident in many ways if one compares ACT voters in 2017 to ACT voters in 2020.
Variable
Voting ACT 2020
Voting National 2020
Voting Greens 2020
Being male
0.07
-0.02
-0.16
The correlations between voting ACT or Green in 2020 and being male are not particularly strong, at 0.07 and -0.16 respectively. But given the sizes of the demographics in question here, the differences are noticable. It’s not enough to say that ACT is for men and the Greens are for women, but future elections could easily entrench this division as the alternative continues to win votes from the Establishment.
In summary, from 2017 to 2020 ACT transformed. In 2017 they were a fringe party for high-income, low-empathy voters. By 2020 they had become a mainstream movement with the potential of challenging National as the de facto leader of the right wing. This was mostly due to a massive influx of old, white, rural voters.
The Four-Fold Rule that ACT appeals mostly to young men, in contrast to National’s appeal to old men and the Greens’ appeal to young women, mostly didn’t apply in 2020. The ACT Party muscled in on some of National’s traditional territory, winning many votes from older people.
The question for 2023 is whether ACT can achieve what parties in the alternative right dream of everywhere: to win enough young men to take power. It’s unlikely that ACT will win many voters from the non-voter demographic, as those tend to be poor and non-aspirational. But if ACT continues to win votes from National, ACT could become the larger of the two, and thereby the official default right-wing party.
*
This article is an excerpt from the upcoming 3rd Edition of Understanding New Zealand, by Dan McGlashan and published by VJM Publishing. Understanding New Zealand is the comprehensive guide to the demographics and voting patterns of the New Zealand people.
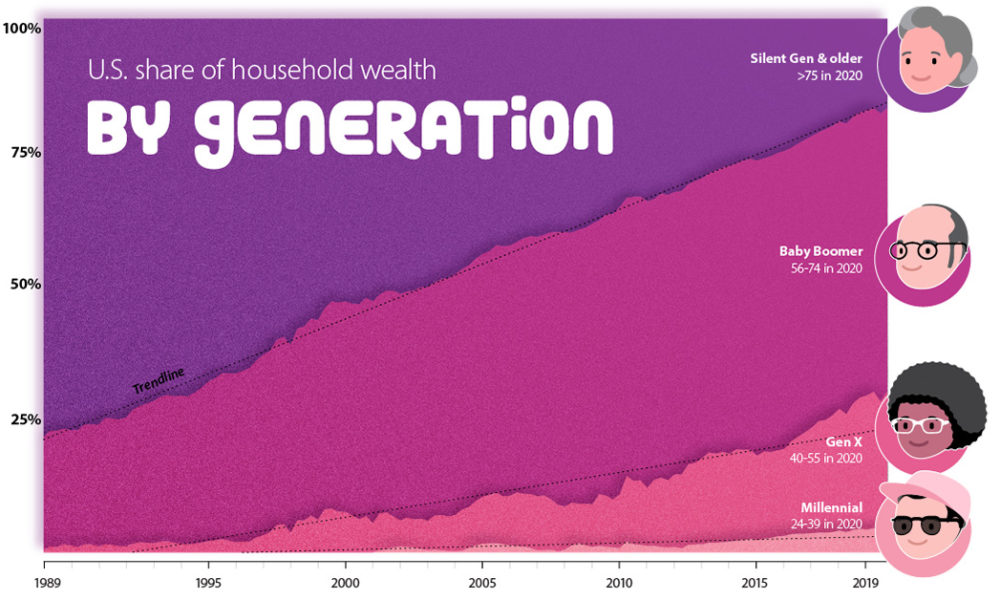
Boomers have been denying it for years, but young people all over the West have now caught on: the Boomers had it much, much better than young people today do. Measuring exactly how much better is hard, but we can guess by comparing how much saved labour Boomers needed to buy a house to how much saved labour younger generations need. Armed with the Reserve Bank’s Inflation Calculator, we can make some educated guesses.
If the last Boomers were born in 1963, graduated high school, then went to university or did a trade apprenticeship, they would have hit the job market – and started looking for a home to raise a family in – in about 1984. Any Boomers older than this would have had an even easier time. So we will compare the house-buying power of a young adult in 1984 with that of a young adult in 2022.
According to qv.co.nz, the average New Zealand house price in October 2022 was $951,040. The Reserve Bank calculator tells us that housing worth $951,040 in October 2022 would be worth $61,854.79 in the first quarter of 1984.
According to the Government’s NZ History page, the average weekly wage in 1984 was $285. This suggests that the average house price was about 217 times the average weekly wage in 1984. In other words, Boomers had to save about 217 weeks’ worth of wages in order to afford the average house.
According to the wage and salary guide at jobted.nz, the average weekly wage in New Zealand in 2022 was $1,093. So the average house price today is about 870 times the average weekly wage. This means that it’s over four times harder for young people today to buy a home they can raise a family in, when compared to Boomers.
The official narrative is that we need to grow wages if we want to bring back the living standards that our parents enjoyed. But there will never be enough wage inflation to bring today’s worker back to that level of prosperity. Our wages would have to quadruple while house prices remained the same. Therefore, if we are to ever enjoy that standard of living ourselves, we have to hope for a house price collapse.
A return to an average house price that was 217 times the average weekly wage would require a fall of 75.1% from current values. This means a fall from around $951,040 to around $236,809. Note that this would not mean that young people today had a better standard of living than the Boomers – it would merely mean that they would have an equal one.
An average house price of $236,809 seems fantastical to young people today.
It’s incredible how much easier life would be for young people in 2022 if the average house cost less than a quarter of a million. It would mean an end to the mortgage slavery that is strangling the West. It would mean that thousands of hours of labour per mortgage holder, currently getting sucked into bank profits, could be redirected to the benefit of families and communities.
That is also why we can’t expect it to happen – there is nothing more profitable than human misery, and mortgage slavery is one of the prime examples of that in the world today. The more expensive houses are, the more human life energy the owners of those houses can absorb from the lower classes in exchange for them. So the ruling class is not likely to change anything anytime soon.
Therefore, the best young Kiwis can hope for, if they want to ever have the same standard of living that the Boomers had, is a house price collapse of at least 75%. The mainstream media will tell us that we’re not allowed to hope for that, because it would mean the destruction of the New Zealand economy. But the status quo is our effective financial enslavement. Something has to give.