Newspeak in 2023

In 1984, the purpose of Newspeak was to make anti-government thoughts impossible. The logic was that if people were prevented by language from talking about opposing the government, they’d also be prevented from thinking about it. Being unable to think about opposing the government, they’d make perfect slaves.

In the West of 2023, our rulers have forced a form of Newspeak on us. As in 1984, the purpose of it is to make dissent impossible. The major difference is that, in our world, Newspeak works by confusing and corrupting existing definitions of words. This has the effect of making communication impossible, and thereby making resistance impossible.

The word ‘racist’ is the classic example of twisted definitions. The word used to refer to people with racial prejudice, who expressed contempt for others for no other reason than their race. But over time, as people displayed a willingness to submit to those shrieking racist, the definition expanded. Today some will argue that the term can only refer to white people.

Ther term ‘racist’ is now so overused that you can be called racist for resisting racism, such as if you say ‘It’s Okay To Be White’. ‘It’s Okay To Be White’ is an explicitly anti-racist statement, used primarily by working-class whites in response to comments such as that of Marama Davidson. That it can be considered racist shows that words (and phrases) can be twisted to their exact opposites in the Newspeak of 2023.

‘Nazi’ is a related example. Originally used to refer to members of the German NSDAP of 1920-1945, it’s now so overused that any nationalist or anti-globalist sentiments are written off as Nazi ones. Today, almost any unfashionable opinion attracts cries of Nazism.

As with racist, a person can explicitly decry Nazism, to the extent of listing multiple grievances with the doctrine, and still get accused of being a Nazi. Trying to distinguish between the nationalist aspects of Nazism and the totalitarian aspects is not permitted. To do so is to become a “Nazi apologist”.

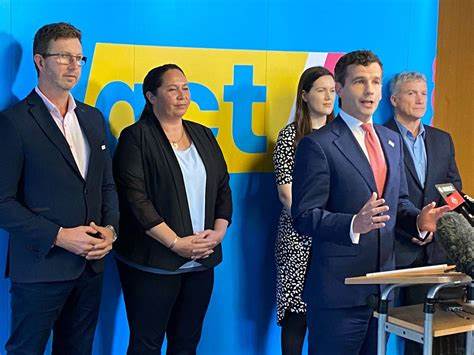
‘Far right’ relates to the above examples. Logically, if the right-wing is capitalist then the far-right ought to refer to hypercapitalist neoliberals like the ACT Party. Bizzarely, however, those described as far-right today are primarily working-class nationalists, whose main complaint is often the corporate importation of cheap labour. Somehow the right-wing are corporates while the far-right is anti-corporate.

‘Nation’ no longer means a population united by ties of blood and soil, as it has always meant. In the Newspeak of 2023, national ties are just like masks that a person puts on and takes off as needed. Anyone can claim to be of any nationality. The dumbing-down of language has obscured the difference between roots citizens and paper citizens. All are considered part of one big club, defined not by Nature but by the Government.

‘Disinformation’ now means ‘anything said by someone the Government doesn’t like’. This has been made evident by the New Zealand Government’s Disinformation Project, which serves as a Ministry of Truth, smearing anyone who speaks out against the ruling class. Enemies of the Government, in Newspeak, are incapable of speaking the truth. Everything they say is either disinformation, misinformation or malinformation.

‘The economy’ now means ‘the interests of international banking and finance’. It doesn’t have anything to do with the material needs of the nation being met. Today’s Newspeak will claim that the economy is doing well because unemployment is low, and will ignore the fact that most of those jobs don’t pay enough for the workers to own homes and raise families.

It doesn’t matter if people can raise families, because, as per the Newspeak definition of nation, the nation doesn’t need families. It can just import them from overseas, and as long as the GDP goes up it’s all good. Herein it can be seen that the Newspeak of 2023 is a form of neoliberal totalitarianism, unlike the national socialist and communist forms of totalitarianism in surface ways, but like them in fundamental ways.

‘Conspiracy theorist’, heard often in the mainstream media of 2023, is classic Newspeak. It’s another term for wrongthinker, denoting someone who is outside of society, a memetic outlaw. Even though human history is a parade of conspiracies, one after the other, anyone who notices a conspiracy in 2023 is equated with the severely mentally ill. ‘Conspiracy theorist’, in 2023 speak, is a synonymn for ‘schizophrenic’, i.e. a person whose paranoia leads them to see things that aren’t there.

There’s a reason why Confucius said that, if he were to be offered power, the first thing he would do would be the “rectification of names” i.e. he would make sure that words had accurate, commonly-understood meanings again. Newspeak was a thing in ancient China just as it was in 1984, and just as it is in 2023. Wherever you have totalitarianism, you have centralised attempts to control expression.

“In the end we shall make thought-crime literally impossible, because there will be no words in which to express it,” Orwell wrote. In 2023 thoughtcrime has been made impossible by the fact that each of us has been trapped in a silo of language, where communication is crippled by an absence of common understanding of the words we are using.

The Newspeak of 2023 has twisted all language, not to the service of Big Brother, but to globohomo – the alliance of globalist capitalism and globalist communism that has forced neoliberalism on the populations of the West. It’s no longer a sure thing that, when a person uses a particular word, that their audience will understand the intended meaning of that word. And so, we’re too confused to resist our ruling classes.

*

If you enjoyed reading this essay/article, you can get a compilation of the Best VJMP Essays and Articles from 2021 from Amazon as a Kindle ebook or paperback. Compilations of the Best VJMP Essays and Articles of 2020, the Best VJMP Essays and Articles of 2019, the Best VJMP Essays and Articles of 2018 and the Best VJMP Essays and Articles of 2017 are also available.

*

If you would like to support our work in other ways, subscribe to our SubscribeStar fund, or make a donation to our Paypal! Even better, buy any one of our books!

Does New Zealand Need A Sadhu System?

New Zealand is currently beset with the question of crime and punishment. The country appears torn between two failed approaches to justice: excessive softness and excessive hardness. Swinging back and forth between the two has led to great dissatisfaction with the Justice System and even talk of vigilante group formation.

Our attitude to justice reflects our moral confusion in the face of what has previously been called the Clown World Fork. Our basic morality is torn between two polar opposites: a wretched, pitiful, Christian doctrine of infinite forgiveness, and a sadistic, paranoid, bestial doctrine of utter destruction. Not having rational balance in our moral philosophy, we also don’t have it in our Justice System.

This has led us to a situation where gang member rapists get lighter sentences than people selling food without a licence. Outcomes like this are possible because we no longer have a shared sense of moral philosophy. There is no longer an agreed scale of heinousness, such that different crimes can be readily apportioned a length of punishment.

It’s time for a moral reset.

It’s time to admit that both Christianity and atheism are dead, and that neither are useful as moral philosophies any more. This means that it’s time to start experimenting with new philosophies. It’s obvious that some kind of new balance needs to be struck, between mercy and severity, for actual justice to be done.

In India there exists something that could be described as the sadhu system. In the sadhu system, criminals can repent by living a low-consumption lifestyle with a view to burning off accrued karmic debt, instead of going to prison. It’s a form of public repentance that New Zealand has no equivalent to. Perhaps we could benefit from one?

A New Zealand equivalent of the sadhu system would involve certain criminals, upon pleading guilty to a crime, to agree to forfeit the right to own property for a set period of time. In exchange, their basic food, clothing and shelter needs are met by the state, and they don’t go to prison or to home detention.

The logic is that many crimes, especially ones of property and violence, are ultimately motivated by egotism, and egotism is ultimately caused by a lack of spirituality. In other words, only a non-spiritual person would become so attached to the material world that they thought it was worth committing crimes to advance oneself here.

In the case of some criminals, dilemmas abound. Some are too dangerous to be allowed to roam the street, but at the same time there may be numerous downsides to sending them to prison. It’s apparent that a third approach is necessary.

This article suggests that certain criminals be offered the choice of prison or becoming part of a new, experimental sadhu system based on the Hindu model. This would entail that the criminal forfeit their right to own property or to accumulate wealth for a certain period of time, in exchange for agreeing to live as a spiritual penitent.

Indian sadhus use a lot of cannabis, which is known to be a spiritual sacrament that induces detachment from the material world. New Zealand sadhus could be given as much cannabis as they feel they need in order to develop beyond their innate clinging to the material world.

New Zealand doesn’t have many Hindu temples, so any introduction of a sadhu system might depend on the previous establishment of a national religion that can accommodate penitents. This might involve a new religion for the Age of Aquarius, such as Elementalism or similar. Perhaps funding could be directed to the construction of an Elementalist temple in every New Zealand town.

Elementalist temples in every town would mean that sadhus could travel as wandering ascetics from town to town, staying at the various temples and hanging out smoking cannabis with the Elementalist priests. These priests, trained in true psychology and not mere huckstering, will be able to help heal the souls of the various sadhus.

The advantages of such a system are many. For one, the Elementalist priests would serve as a kind of psychiatric service to the sadhus, helping them understand their place, and the place of humanity, in the grand scheme of creation. They would explain the laws of karma and the possible reasons for a lowly birth in this life.

The inevitable, knee-jerk reaction to this idea on the part of many is to bemoan the low productivity of the sadhus. But productivity and consumption go hand-in-hand. If we’re going to make a genuine effort to prevent the destruction of the Earth’s climate, we need to encourage people to live low-consumption lifestyles whenever possible.

A sadhu system could provide a neat and voluntary alternative path to rehabilitate criminals. We’re tried breaking them into submission and we’ve tried treating them like children – both approaches failed. Let’s try the spiritual approach, wherein we incentivise the criminally-minded to abandon the material world and to work on eliminating karmic debt.

*

If you enjoyed reading this essay/article, you can get a compilation of the Best VJMP Essays and Articles from 2021 from Amazon as a Kindle ebook or paperback. Compilations of the Best VJMP Essays and Articles of 2020, the Best VJMP Essays and Articles of 2019, the Best VJMP Essays and Articles of 2018 and the Best VJMP Essays and Articles of 2017 are also available.

*

If you would like to support our work in other ways, subscribe to our SubscribeStar fund, or make a donation to our Paypal! Even better, buy any one of our books!

Understanding New Zealand 3: Who Turned Out To Vote In 2020?

The final chapter of this book answers the question of which demographics turned out to vote in the 2020 General Election. In total, 2,919,073 people cast a party vote, out of 3,549,580 eligible voters, for a turnout rate of 82.24%. This was higher than in 2017, breaking the usual trend of declining turnout rates in Western democracies.

Turnout rate is very closely related to general disenfranchisement, hence the General Disenfranchisement Rule. As we can see in the analysis below, it’s possible to tell who is running society from the extent of their engagement in the political system. The higher the turnout rate, the higher the engagement, the more power and influence.

VariableTurnout rate 2020
Voting Labour 20200.28
Voting National 20200.69
Voting Greens 20200.39
Voting ACT 20200.81
Voting New Zealand First 20200.10
Voting New Conservative 20200.52
Voting The Opportunities Party 20200.63
Voting The Maori Party 2020-0.69
Voting Advance NZ 2020-0.16
Voting Sustainable NZ 20200.53
Voting ALCP 2020-0.52
Voting TEA Party 2020-0.24
Voting Heartland NZ 20200.06
Voting Social Credit 20200.34
Voting NZ Outdoors Party 20200.28
Voting ONE Party 2020-0.03
Voting Vision NZ 2020-0.68

Perhaps more than any other measure, the correlations between party affiliation and turnout rate reveal who the true ruling class of New Zealand is. Those who turn out to vote are those psychologically engaged with the political system. They are those with a reasonable expectation that a politician might listen to them.

The top tier by this measure are ACT, National and The Opportunities Party. The correlation between turnout rate in 2020 and voting ACT in 2020 was 0.81; with voting National in 2020 it was 0.69; with voting The Opportunities Party in 2020 it was 0.63. These voters comprise society’s insiders – the wealthy and influential. They are the people who are in charge almost no matter what the political system is.

Immediately underneath them are New Conservative, Greens and Labour voters. The correlation between turnout rate in 2020 and voting New Conservative in 2020 was 0.52; with voting Greens in 2020 it was 0.39; with voting Labour in 2020 it was 0.28.

New Conservative voters are old and old people have very high turnout rates (see below). Greens voters are young but are usually from wealthy families and are usually well-educated. The significant positive correlation between turnout rate in 2020 and voting Labour in 2020 is harder to explain. In truth, Labour voters are part of the political Establishment.

The three parties whose supporters were least likely to turn out to vote were the Maori Party, Vision NZ and the ALCP. The correlation between turnout rate in 2020 and voting Maori Party in 2020 was -0.69; with voting Vision NZ it was -0.68 and with voting ALCP it was -0.52. It’s not news that Maori people tend to be disenfranchised, and all three of these parties have a high proportion of Maori voters.

VariableTurnout rate in 2020
No NZQA qualifications-0.30
Level 1 certificate0.01
Level 2 certificate-0.10
Level 3 certificate-0.49
Level 4 certificate-0.10
Level 5 diploma-0.25
Level 6 diploma0.73
Bachelor’s degree0.20
Honours degree0.42
Master’s degree0.27
Doctorate0.42

It’s well understood that the more educated someone is, the more enfranchised they tend to be. Educated people can express themselves in agreeable and persuasive ways, and tend to be more influential thereby. People with university degrees are heavily over-represented in Parliament, even among Labour Party MPs.

Therefore, it’s not surprising to see significant positive correlations between having any of the postgraduate university degrees and turnout rate in 2020.

It might be surprising to see that the correlation between having a Bachelor’s degree and turnout rate in 2020, while positive, was not significant. After all, a large proportion of the managerial class have that qualification. But the explanation is simple: most people with degrees are young, and young people tend not to vote (see below).

There was a significant negative correlation between turnout rate in 2020 and having no NZQA qualifications (-0.30). Many would have expected this to be stronger, but people in the older age groups are much more likely to have no NZQA qualifications than people in the younger age groups, balancing out the fact that older age groups are more likely to vote.

VariableTurnout rate in 2020
Aged 20-24-0.26
Aged 25-29-0.23
Aged 30-34-0.15
Aged 35-39-0.07
Aged 40-440.27
Aged 45-490.54
Aged 50-540.63
Aged 55-590.67
Aged 60-640.65
Aged 65-690.64
Aged 70-740.65
Aged 75-790.65
Aged 80-840.64
Aged 85+0.65

The origin of the widespread dislike of Boomers can be noted in the table above. Old people are far more likely to turn out than younger ones. Even taking into account the fact that people under 18 can’t vote, old people are much more likely to vote in New Zealand than younger ones.

There was a negative correlation between turnout rate in 2020 and being in any age group under 40 years old. This shows that New Zealand is little different to other modern democracies when measured by the turnout rate of young people.

There was a strong positive correlation (0.63 or stronger) between turnout rate in 2020 and being in any age group above 50 years old. The over-50s hit the polling booths in massive proportions. If the General Disenfranchisement Rule shows us anything, it’s that Boomers are enfranchised.

The age group between 40 and 50 appears to be when, in New Zealand, the transition from liberal to conservative is made. This is also when the transition from renter/mortgage holder to homeowner is usually made. These two apparent facts are intimately related. Not until most people become homeowners themselves do they feel an interest in conserving the status quo.

VariableTurnout rate in 2020
Percentage of males-0.04

Contrary to the expectations of some – but which could be surmised by many – there is no statistical evidence that men are more enfranchised than women. Although the historical example has been one of male dominance, there is little evidence that this state of affairs exists in the present day. Indeed, the correlation between turnout rate in 2020 and being male was negative (if too weak to be significant).

This could be guessed by anyone who knew that the correlations between being male and holding any of the university degrees were all negative. However true the historical example of male dominance might be, the experience of today is closer to the opposite.

VariableTurnout rate in 2020
Being European0.83
Being Maori-0.67
Being Pacific Islander-0.63
Being Asian-0.20

Anyone who thinks that white Kiwis and Maori Kiwis are roughly equally enfranchised would get a shock from looking at the statistics.

The correlation between turnout rate in 2020 and being of European descent was extremely strongly positive, at 0.83. This is one of the strongest correlations in this entire study, of either direction. The correlation between turnout rate in 2020 and being of Maori descent, by contrast, was strongly negative, at -0.67.

It might be true that Maoris are technically over-represented in Parliament, in that there are more Maori MPs than the Maori proportion of the population would warrant, but that isn’t the same thing as enfranchisement. Enfranchisement is when you can reasonably expect your MP to listen to you and to take your concerns seriously, whatever their race.

Pacific Islanders are about as disenfranchised as Maoris. The correlation between turnout rate in 2020 and being a Pacific Islander was -0.63. This cannot be explained by Pacific Islanders being outside the bicultural system, because the correlation between turnout rate in 2020 was much less negative, at -0.20. Thus, poor education and low levels of wealth better explain the low Pacific Islander turnout.

Some might argue that Asians vote in high numbers out of a sense of duty, and are not truly enfranchised. That may be true to some extent. Nonetheless, the fact is that if Asians do vote in high proportions, they will have a significant influence on the vote (see the cannabis referendum for an example).

VariableTurnout rate 2020
Income < $5,000-0.70
Income $5,000-$10,000-0.43
Income $10,000-$20,000-0.23
Income $20,000-$30,0000.16
Income $30,000-$50,000-0.19
Income $50,000-$70,0000.28
Income > $70,0000.45

The correlations between income groups and turnout rate in 2020 will surprise few. With a few exceptions, these correlations follow the General Disenfranchisement Rule closely, in that the rich tend to vote and the poor tend to not vote.

Voters in every income group below $20,000 had a significant negative correlation with turnout rate in 2020. This is not surprising, as most beneficiaries will be in this category, and beneficiaries comprise a large proportion of society’s most disenfranchised people.

Voters in both income groups above $50,000 had a significant positive correlation with turnout rate in 2020. The strongest was between having an income above $70,000 p.a. and turnout rate in 2020, which was 0.45. It is people in this group who politicians listen to the most.

The general rule is obvious: the wealthier a person is, the more enfranchised they tend to be. This rule is already widely understood, but it’s useful to put some numbers to it.

It might seem paradoxical that the correlation between turnout rate in 2020 and having an income between $20,000 and $30,000 is positive, while the correlation between turnout rate in 2020 and having an income between $30,000 and $50,000 was negative. This is because those receiving between $20,000 and $30,000 tend to be students and pensioners, and therefore not really disenfranchised, whereas those between $30,000 and $50,000 tend to be minimum wage workers or in other working-class occupations, and therefore closer to the bottom of society than either students or pensioners.

VariableTurnout rate in 2020
Working as a manager0.56
Working as a professional0.30
Working as a technician or trades worker0.01
Working as a community or personal services worker-0.33
Working as a clerical or administrative worker-0.14
Working as a sales worker-0.35
Working as a machinery operator or driver-0.61
Working as a labourer-0.30

The two most privileged occupations are the two most enfranchised ones. Both of the correlations between turnout rate in 2020 and working as either a manager (0.56) or as a professional (0.30) were significantly positive. Ultimately it’s managers and professionals who run society, and so it’s them that politicians listen to the most.

People in middle-class jobs had moderate levels of enfranchisement. Neither of the correlations between turnout rate in 2020 and occupation were significant in the case of working as a clerical or administrative worker (-0.14) or working as a technican or trades worker (0.01). The latter correlation might even be more positive than expected, a result of the fact that technicians and trades workers tend to be in the relatively elderly age groups, and those age groups have high turnout rates.

Working-class Kiwis were the most disenfranchised. There was a significant negative correlation between turnout rate in 2020 and working as any of a machinery operator or driver (-0.61), sales worker (-0.35), community or personal services worker (-0.33) or labourer (-0.30). Politicians don’t generally care what people in these occupations think, hence the disenfranchisement.

VariableTurnout rate in 2020
No source of income-0.69
Income from wage or salary-0.19
Income from self-employment or own business0.68
Income from interest, dividends, rents or other investments0.83
Income from ACC or private work insurance-0.13
Income from NZ Super or Veteran’s pension0.64
Income from Jobseeker Support-0.74
Income from Sole Parent Support-0.77
Income from Supported Living Payment-0.39
Income from Student Allowance-0.22

The cynical will feel proven correct when they hear that the correlation between turnout rate in 2020 and receiving an income from interest, dividends, rents or other investments was 0.83, one of the strongest correlations in this study. It is people who receive an income in this manner who are the most enfranchised of all.

Also highly enfranchised are people who receive an income from self-employment or one’s own business, and people who receive an income from NZ Super or Veteran’s pension. The correlation between turnout rate in 2020 and the former was 0.68, and with the latter it was 0.64.

These three groups of income recipients are the people that politicians listen to the most. A high proportion of them work as managers, whether hired or inheritors.

Perhaps dishearteningly, there was a negative (if not significant) correlation between turnout rate in 2020 and receiving an income from a wage or salary: -0.19. This suggests that the people who do most of the work in our society, whose efforts keep it running, are disenfranchised, nearly significantly so.

The most disenfranchised Kiwis are those on unemployment, sickness or invalid’s benefits. These are society’s forgotten, who have the lowest status and who politicians listen to the least. The correlation between turnout rate in 2020 and receiving income from Jobseeker Support was -0.74, and between turnout rate in 2020 and receiving income from Sole Parent Support was -0.77.

The correlation between turnout rate in 2020 and receiving income from a Student Allowance was negative, but not significantly so (-0.22). Again, this is because students occupy an usual place in the class hierarchy: disenfranchised by age, enfranchised by class. As such, their turnout rate was higher than the other non-pensioner beneficiaries.

VariableTurnout rate in 2020
Has no religion0.48
Is a Buddhist-0.10
Is a Christian-0.20
Is a follower of the Maori religions-0.62
Is a Hindu-0.29
Is a Jew0.22
Is a Muslim-0.32
Is a Spiritualist or New Ager0.33

That New Zealand is a materialist society is shown by many things, and the correlations between turnout rate in 2020 and following a religion is another of those things. The religious affiliation that had the strongest positive correlation with turnout rate in 2020 was having no religion (0.48). This will surprise many who think of atheists as degenerate outsiders. In fact, the people running this society tend to have no religion.

There was a strong negative correlation between following one of the Maori religions and turnout rate in 2020 (-0.62). This is no doubt a function of the significant negative correlation between being Maori and turnout rate in 2020.

Weaker, although still negative, correlations were found between turnout rate in 2020 and being a Muslim (-0.32), a Hindu (-0.29), a Christian (-0.20) or a Buddhist (-0.10). The correlation with Christianity will surprise many, as it is generally assumed that Christians comprise a large part of the power structure in New Zealand. Although this is true, a high proportion of practicising Christians in New Zealand are relatively disenfranchised Pacific Islanders.

VariableTurnout rate in 2020
No children-0.03
One child-0.38
Two children0.56
Three children0.34
Four children-0.21
Five children-0.58
Six or more children-0.74

Another nonlinear set of correlations are those between turnout rate in 2020 and number of children.

Some might expect that, since people with no religion have a high turnout rate, and since people with no religion often have no children, that people with no children must have a high turnout rate. This is not the case. The correlation between turnout rate in 2020 and having no children was -0.03.

The strongest positive correlation between turnout rate in 2020 and having any number of children was with two children (0.54), followed by three children (0.34). These correlations represent modal families, in the sense that most upper-middle-class families will have two or three children.

There was a negative correlation between turnout rate in 2020 and any of having four children (-0.21), five children (-0.58) or six or more children (-0.74). This reveals that two is the normal number of children to have, and that a person becomes more disenfranchised the more children they have beyond two.

VariableTurnout rate in 2020
Own or part own house0.68
Own house in family trust0.62
Neither outright ownership of house nor house in family trust-0.79

One of the main reasons why housing is a major issue in most Western countries right now is that it relates to the feeling of being part of society. For many people, if they don’t own a house they don’t feel like they have a stake in society, and those who don’t feel like they have a stake in society tend to not bother voting.

Reflecting this is the extremely strong negative correlation between turnout rate in 2020 and neither owning a house nor owning a house in a family trust. This was -0.79, showing that non-houseowners are one of New Zealand society’s most disenfranchised groups, despite also being a very large one.

The correlation between turnout rate in 2020 and owning or part-owning a house, by contrast, was 0.68. This is very strong, and shows that homeowners definitely consider themselves listened-to by the political establishment.

In summary, the turnout rates among the various demographics in the 2020 General Election reflect the extent to which those various demographics are enfranchised by the political establishment. ACT/National-voting, old, educated, atheist, white, homeowning managers and professionals of either gender are those primarily enfranchised by the current order, and Maori Party/ALCP-voting, young, poorly-educated, Maori and Pacific Islander, renter labourers and beneficiaries are those primarily disenfranchised.

*

This article is an excerpt from the upcoming 3rd Edition of Understanding New Zealand, by Dan McGlashan and published by VJM Publishing. Understanding New Zealand is the comprehensive guide to the demographics and voting patterns of the New Zealand people.

*

If you enjoyed reading this essay/article, you can get a compilation of the Best VJMP Essays and Articles from 2021 from Amazon as a Kindle ebook or paperback. Compilations of the Best VJMP Essays and Articles of 2020, the Best VJMP Essays and Articles of 2019, the Best VJMP Essays and Articles of 2018 and the Best VJMP Essays and Articles of 2017 are also available.

*

If you would like to support our work in other ways, subscribe to our SubscribeStar fund, or make a donation to our Paypal! Even better, buy any one of our books!

The Biggest False Assumptions Made By Western Culture

The talking heads representing Western culture like to pretend that we’ve got everything squared away. That our ruling class has an accurate perception of the world and where it’s going, and therefore that everything is in good hands. The truth is far from this. Mainstream Western culture actually makes a number of false assumptions.

One of the most prominent is that nationalism is inherently violent. This falsehood is pushed heavily by the globalist interests who own the mainstream media. They have created the impression that nationalism and xenophobic aggression inevitably go together. This impression is reinforced by history channels full of footage of goosestepping German soldiers and snippets of Hitler speeches.

In reality, pro-nationalist sentiments are no more violent than pro-family ones. Nothing about a general attitude of caring for fellow members of one’s own nation is inherently more xenophobic or aggressive than a general attitude of caring for fellow members of one’s own family. In-group favouritism only implies out-group antipathy in a relative sense, not an absolute one.

Related to this is the delusion that democracy is inherently anti-tyranny. As with the previous false assumption, this delusion has resulted from propaganda in World War II and the Cold War. Democracy fought authoritarian national socialism and then authoritarian communism in the Cold War, therefore democracy is considered to naturally oppose tyranny.

In reality, democracy is just as capable of tyranny as any other system. The concept of “the tyranny of the majority” refers to this. New Zealand saw an blatant example of it with the 2020 cannabis referendum, the end result of which was that 48.4% of the population lost the right to use cannabis because 50.7% of the population voted for authoritarianism.

Underpinning democracy in the 21st Century is the false assumption that there is no genetic influence on behaviour. Humans are blank slates, we are told, and all are much the same as any other. Therefore, it’s possible for any number of them to be swapped out for cheap labour from across the world, and for everything to work out just as well.

It’s true that humans are born closer to a blank slate than any other animal is. However, human behavioural outcomes are still highly restricted by what the genes will allow. Intelligence is some 80% heritable by adulthood, which means that some populations will invariably become wealthier than others. Ultimately, society is a racial construct. As such, changing a society’s racial composition inevitably changes that society.

Another major behavioural false assumption states that behaviour is mostly the consequence of schooling. This assumption is commonly heard in reference to the Australian 501 deportees to New Zealand. The logic is that because these deportees are graduates of the Australian school system, their behaviour is Australia’s fault. But a person’s criminal inclinations are wired into place long before they finish (or even start) their schooling.

Erik Erikson accurately described the psychosocial challenges of human development, explaining that the first 24 months of life are the most crucial. Infants who don’t receive a loving and supportive environment in the first 24 months make up a majority of the world’s criminals. Early childhood abuse and neglect are the ultimate causes of most antisocial behaviour. So the parents are to blame far more often than the schooling.

Related to all the false assumptions about human development is the popular globalist falsehood that all human populations are precisely the same intellectually. Evolution, many believe, may have created a variety of different skin colours, hair colours, eye colours, body shapes and musculatures, but at no point did it play any role in shaping the brain, whether neurologically or behaviourally.

In fact, human populations vary greatly in intellectual capacity. Sub-Saharan Africans have an average IQ of 70, whereas North East Asians have an average IQ of 105. This is over two standard deviations of difference. National IQs correlate more strongly with national distance from the Equator (supporting the late Richard Lynn’s Cold Winters Theory) than with any social measure. As such, the varying economic outcomes among the different human populations can most accurately be ascribed to different IQ levels.

The same over-agreeable fools who believe that particular false assumption also tend to believe another one: that women are happier having careers than families. This falsehood has been engineered by corporate media interests who want women joining the workplace to increase the labour supply. In truth, as anyone who has worked in an office knows, women are only rarely happy in full-time work outside of the family home.

Gaddafi, in his Green Book, lays out the reality about women in the chapter devoted to that topic. Of course women ought to be free to work and to have careers if they so choose. But their natural function is to bear and to raise children. Therefore, if women are prevented from this function on account of that they are forced to work, then they aren’t free, and can’t be expected to be happy. The assumption that career women are happier than other women is nonsense.

Perhaps the most pervasive false assumption of all – so pervasive that even to question it is considered by most people to be tantamount to admitting insanity – is that science has proven materialism. Before Darwin, the common story goes, some people believed that God created everything. But after Darwin, God was disproven.

Scientific proof of evolution is one thing, but scientific proof of consciousness is another. There is no scientific evidence whatsoever that the brain generates consciousness. This means, logically, that there is no evidence that consciousness ends when the brain dies. It follows, therefore, that consciousness is the prima materia, and not the physical world.

This logic is denied by most. Few people today have avoided falling under at least one of the false assumptions listed above. This is one of the primary reasons why life in the clown world of today is so bizarre, frightening and obscene.

*

If you enjoyed reading this essay/article, you can get a compilation of the Best VJMP Essays and Articles from 2021 from Amazon as a Kindle ebook or paperback. Compilations of the Best VJMP Essays and Articles of 2020, the Best VJMP Essays and Articles of 2019, the Best VJMP Essays and Articles of 2018 and the Best VJMP Essays and Articles of 2017 are also available.

*

If you would like to support our work in other ways, subscribe to our SubscribeStar fund, or make a donation to our Paypal! Even better, buy any one of our books!