
Should New Zealand Reduce Pensions To The Level of Other Benefits?

When the pension system was introduced in New Zealand in 1898, the average life expectancy was less than 60. Today, it’s closer to 80. Consequently, pension expenses have ballooned. This article discusses whether New Zealand should lower the pension to bring it in line with other main benefits, and what we could afford if we did.

A lot of words are being written lately about universal basic income, but few realise New Zealand already has a universal basic income for the over 65s, known as National Superannuation.

The argument for paying out this universal benefit is that people older than 65 cannot reasonably be expected to earn a living through the workforce, and therefore would starve without a pension. That seems entirely fair. Not many people would argue that a person should be forced to starve, in this age of plenty, just because they were too old to work.

However, the amount of money paid in pensions is taking the piss. $360 per week to every person over 65, when a majority of them own their own house, is an obscenity, when we expect severely mentally ill people to survive on $273 per week, out of which they almost always have to pay rent.

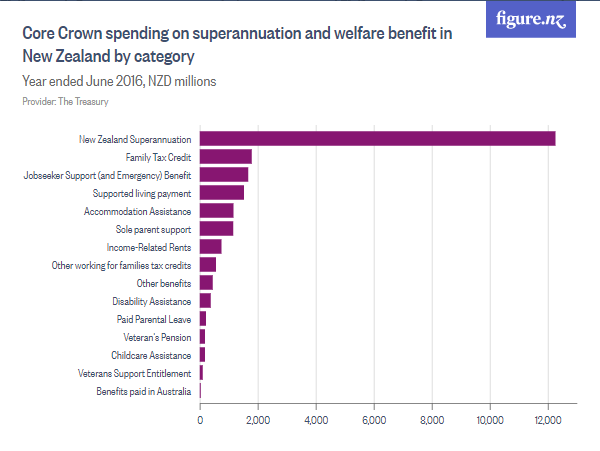
As of June 2019, the New Zealand Government spends over $12,000,000,000 every year on pensions (see table at top of article). This mostly consists of the $20,000 of yearly pension payments per recipient, multiplied by the 600,000+ eligible pensioners in New Zealand. Pension spending is projected to be $20,000,000,000 by 2031.

Although most people can agree that it’s cruel to leave people to starve on account of that they’re too infirm to work, there’s no reason for the Government to be granting pensioners a lifestyle that compares with what people make from working. Indeed, if they’re not working, why should they be paid any more than the unemployment benefit?

A fair compromise between the current luxury pension model on the one hand, and reducing the pension to the level of the unemployment benefit on the other, might be to reduce the benefit to a midway level. This would recognise both that current pension spending is an unsustainable and unfair burden on the under-65s, and that the infirmity of old age demands more expenses than the health of youth.

If the pension was cut by 25%, from its current $360 per week to around $270, this would bring it in line with other main benefits such as the Supported Living Allowance. This 25% reduction would equal a savings of $3,000,000,000 per year in pension expenses.

To give an example of how much money that is, it’s roughly equal to the $3,000,000,000 in tax revenue that the Government gets from the 10.5% tax on the first $14,000 of income. This tax works out to slightly less than $1,500 per person for each of New Zealand’s roughly 2,000,000 wage or salary earners.

So lowering the pension by 25% to bring it in line with other main benefits could be balanced by making all income up to $14,000 tax free. This would be a revenue-neutral move – there are plenty of other ways to spend $3G, but this would be one of the most popular.

Introducing a $14,000 tax-free threshold would make two million New Zealanders much happier about going to work every day. It would revitalise the workforce by giving every worker an extra $1,500 per year. This works out to almost $30 per week. That would make a huge difference to standard of living given the cost of living and cost of housing at the moment.

For two-parent families, such a saving would equal roughly $60 per week. For many Kiwi families on the breadline, this would be enough money to make the difference between survival and disaster some weeks.

There’s no loss to bringing this in, apart from a reduction in luxuries for our current crop of pensioners. None of those pensioners will go hungry because they would still get as much as an invalid’s beneficiary, and considering that these same pensioners had the luxury of being able to buy a house on one income – a luxury that younger generations will never have – there’s no reason for the rest of us to spend empathy on them. We ought to keep it for each other.

At the moment, New Zealand is being sucked dry by a cohort of super-entitled Baby Boomers who feel that they have the right to party it up for 20 years after they reach 65. This was only sustainable when pensioners were a small percentage of the population, but with as much as 20% of the population soon wanting a slice of the pension pie, it no longer is.

We need to bring the pension in line with other main benefits in order to rein in our bloated Superannuation expenses. Reducing it to the same level as the Supported Living Allowance would free up roughly three billion dollars every year. Freeing our economy from this burden would make life a lot easier for the vast majority of Kiwis.

*

If you enjoyed reading this essay, you can get a compilation of the Best VJMP Essays and Articles of 2018 from Amazon for Kindle or Amazon for CreateSpace (for international readers), or TradeMe (for Kiwis). A compilation of the Best VJMP Essays and Articles of 2017 is also available.

The Best Way to Raise Wages Is to Strengthen The Negotiating Position of The Working Class

Low wages are blamed by many for the various social ills befalling the nations of the West. If only wages were higher, a lot of problems with housing, education and healthcare would be solved. Although this is true on the face of it, little thought goes into what actually leads to high wages. This essay explains.

A popular belief, particularly among young leftists, is that the wage being paid reflects the employer’s goodwill. This is true to a minor extent (it reflects the degree of solidarity that the employer has with their employees), but in practice the size of a wage reflects little else than the respective negotiating strengths of the employer and the employee.

These people don’t understand that a person’s wage is the result of a negotiation process, and that this process is determined by economic principles. In particular, the wage reflects what the employer and employee each have for a Best Alternative to a Negotiated Agreement (BATNA) – the alternative that would arise if negotiations failed and both parties walked away from the table.

If the employer’s BATNA is to lose production and fail to fill orders because they are short-staffed, that employer’s negotiating position is weak. Likewise, if the employee’s BATNA is to get a well-paid job somewhere else, that employee’s negotiation position is strong.

Conversely, if the employer’s BATNA is to get the Immigration Minister to import cheap labour from the Third World and to hire them instead of a local, then that employer’s negotiating position is strong. Likewise, if the employee’s BATNA is that his family back in the Third World starves, that employee’s negotiating position is weak.

So it can be seen that a person’s wage is chiefly a function of the demand for that person’s labour and the supply of competing labour. All other factors being equal, the greater the demand for that person’s labour, the higher the wage, and the greater the supply of competing labour, the lower the wage.

If one wishes to raise wages, then, the only thing that will reliably work is to restrict the supply of the labour competing for those wages.

The capital owners of the West have always striven to minimise their labour expenses. The most effective way to do this is through slavery, because then the capital owners get labour (effectively) for free. The American cotton and sugar plantations of the 18th and 19th centuries were profitable because slavery minimised their labour expenses, and the closer a modern company can get to free labour, the better.

In the 21st century, the way to keep wages low is to import cheap labour from overseas. This has the massive benefit of allowing the capital owner to undercut the native working class, and to pay a fraction of their wage to the new imports instead. If the cheap labour is from a poor country, they will often be happy to live 20 to a house so that they can send some of their wages home in remittances.

Many modern enterprises in the West are only profitable because of importing cheap labour, but allowing this is a form of corruption that harms the working class. In a natural capitalist system, companies that can’t pay a living wage to their employees go out of business because they can’t find staff. Under the system we have, those companies import cheap labour and their previous staff go on the dole.

Despairingly, many leftists now think it is “racist” to oppose open borders, on the grounds that it’s mean to tell non-white people they can’t live in the West. These leftists are indifferent to the argument that opening the borders to cheap labour is against the class interests of the working poor. In fact, they often verbally abuse those working-class people for agitating for their own class interests, while the capital owners laugh all the way to the bank.

There is only one reliable way to increase the wages of labour. This way is to improve the negotiating position of the working classes. The negotiating position of the working classes can only be increased in two ways: by increasing the demand for labour, and by decreasing the supply of labour.

Only if the best alternative to a negotiated high wage is another high wage will the employer pay one. If the worker asks for a living wage and cheap labour is available, the employer will go with the cheap labour in almost every case. The employer doesn’t give a shit if this leaves the original worker unemployed – the cheaper the labour, the more profits for them.

The sad truth is that the international capitalist interests who have created this arrangement also own the mainstream media. As a result, this media has convinced us that this state of affairs is natural and that anyone who complains about their wage must be a racist. They don’t care if they’re hated – they still own everything and hate doesn’t stop them. What they do care about is a weakening of their negotiating position.

The New Zealand Labour Party – like neoliberal parties everywhere – has completely betrayed the New Zealand working class by keeping the floodgates of cheap labour wide open. It is by doing this that the Labour Party have kept wages low and contributed to the current social problems. As this magazine has argued previously, this betrayal risks that the New Zealand working class turns to fascism. The only way out is to strengthen the negotiating position of the workers.

*

If you enjoyed reading this essay, you can get a compilation of the Best VJMP Essays and Articles of 2018 from Amazon for Kindle or Amazon for CreateSpace (for international readers), or TradeMe (for Kiwis). A compilation of the Best VJMP Essays and Articles of 2017 is also available.

The Black Caps ODI Bowling and Batting in 2019 Compares Well To Great Players of the Past

The 2019 Black Caps are arguably the best ODI side that New Zealand has ever produced. But how good are they in comparison to their historical peers of other nations? Numbers man Dan McGlashan, author of Understanding New Zealand, looks at how our bowling and batting compares to some great lineups of the past.

Some people call Trent Boult the ‘White Akram’ for his relentlessly accurate line and mastery of seam and swing at 140km/h. If you compare Boult’s numbers to Akram’s, Boult comes out looking very well indeed.

Wasim Akram’s ODI career stretched from 1984 to 2003. Over these two decades, he racked up a truly phenomenal 502 wickets at an average of 23.52. Compared to the bowlers of his era, Akram had a bowling average 24% lower that the average of all bowlers from those same years (the overall bowling average between 1984 and 2003 was 29.19).

Compared to the bowlers of his era, however, Boult’s bowling average of 24.80 is 28% lower (the overall bowling average between 2012 and 2019 is 31.92). This is extremely impressive if one considers that it means that Boult is even more of an outlier in comparison to his international ODI fast-bowling peers than Wasim Akram was.

Despite the memories of him as an outstandingly destructive bowler, Akram’s strike rate is not as impressive as his economy rate. Akram’s strike rate of 36.2 is only 6% better than the average strike rate of his era (38.5). His economy rate of 3.89, however, is a full 16% better than the average economy rate between 1984 and 2003.

This is not so much true of Boult. The Kiwi paceman’s strike rate of 29.3 is 23% better than the average strike rate during his career, and his economy rate of 5.06 is 5% better than the global economy rate of 5.31 during this time. He is like Akram in that his accuracy allows for both economy and strikepower, only Boult has more of the latter and Akram more of the former.

If Boult is the White Akram, then Matt Henry is the White Waqar Younis. As Younis was to Akram, Henry is more expensive than Boult but also more destructive with the ball.

Compared to the bowlers of his era, Younis had a bowling average 23% lower than the average of all bowlers from those same years (the overall bowling average between 1989 and 2003 was 29.40). This is roughly similar to Akram, but where Younis was really impressive was his strike rate of a wicket every 30.5 balls. This was 26% better than the 38.4 average global strike rate during Younis’s career.

Compared to the bowlers of his era, Henry has a bowling average 29% lower than his peers (the overall bowling average between 2014 and 2019 is 32.27). Incredibly, his strike rate of 27.2 is 32% better than the global average of 35.9 during his career. This means that, statistically, Henry is an even more destructive bowler than Waqar Younis was – even after you account for the fact that strike rates are lower nowadays.

Some of Henry’s detractors claim that he is hittable, but this is no more true of Henry than it was of Younis. Younis was 1.8% more expensive than the average of his era; Henry is 1.7% more expensive. These are very slim margins compared to the average bowler, and more than compensated for by the vastly superior strike rate.

If you’re surprised that the Black Caps’ ODI opening bowling duo has stats that back up well when compared to arguably the best new-ball pair of all time, get ready for another surprise. Their top-order batting trio of Martin Guptill, Kane Williamson and Ross Taylor have stats that back up well when compared to those of Mathew Hayden, Ricky Ponting and Damien Martyn.

Guptill and Hayden have almost identical batting averages: 43.87 vs. 43.80. For Guptill, this represents being 40% above the average cost of a wicket over the years of his career (31.28). For Hayden, it represents being 48% above the average cost of a wicket over the years of his (29.66).

When it comes to strike rate, Hayden’s 78.96 was right on the average strike rate of his time (79.28), despite his reputation as a massive hitter. Guptill is worth an extra couple of runs per 100 balls, with a strike rate of 87.99 compared to the global average of 86.96 during his career.

For Guptill to have roughly equal stats to those of the Australian opener from their greatest ever batting era is amazing enough, but there are two others in the Black Caps lineup who compare just as favourably to their counterparts in that great Aussie side.

At No. 3, Williamson’s numbers come out looking very good compared to Ponting’s. The Kiwi captain’s average of 45.85 is 45% above the average wicket during his career. The former Australian captain’s average of 42.03 is slightly behind this benchmark, at 40% above the average.

Ponting’s strike rate was relatively better, however: his 80.39 is right on the era strike rate of 80.66. Williamson’s 82.32, by contrast, is 6% slower than the average batsman of his time. In Williamson’s favour, though, he is still only 29, and therefore only just now entering the peak of his career. His numbers might well be even more impressive in six years’ time.

At No. 4, Taylor has fashioned a record that compares well to players in any time and era. His average of 48.55 is 56% higher than the average batting average throughout his career (31.05). Martyn’s average of 40.80, while much higher than the 29.66 global average during his career, was only 38% higher.

That means that, as much as Martyn was a rock at 4 for Australia, Taylor is even more so for New Zealand.

Overall, when one compares the statistics of some of our current crop of Black Caps to their contemporaries, the distance they are ahead of the average compares well to some of the great players of days past. Not only is this a highly underrated Black Caps side, but they have an entirely realistic chance of winning the World Cup this year.

*

Understanding New Zealand, by Dan McGlashan and published by VJM Publishing, is the comprehensive guide to the demographics and voting patterns of the New Zealand people. It is available on TradeMe (for Kiwis) and on Amazon (for international readers).

Matt Henry Is Now The Most Underrated Player In The Black Caps

In 2017, numbers man Dan McGlashan explained how Ross Taylor was the most underrated player in the Black Caps. In 2018, he explained how that mantle had passed to Henry Nicholls. This year, as McGlashan will show in this article, the most underrated player in the Black Caps is Canterbury’s Matt Henry.

Trent Boult is undoubtedly the hero of the Black Caps bowling attack. In ODIs, he has taken 148 wickets at an average of 24.83. Currently ranked No. 2 in the world for ODI bowling, many would go as far as to argue that Boult was the Black Caps’ most influential player. Everyone knows that his opening spell is crucial to the team’s success.

Few such accolades fall on Matt Henry. Far from being considered the spearhead, his place in the side seems far from certain. Many fans appear to prefer Tim Southee or even fringe candidates such as Scott Kuggeleijn or Hamish Bennett. However, much like Henry Nicholls a year ago, Henry has put up some excellent numbers that, if considered in context, mark him as a potentially world-class option.

If one looks simply at the numbers, Henry is not far behind Boult. From 44 games, he has taken 81 wickets at an average of 25.60. He hasn’t had as much gametime as many think he deserved, but this has kept him hungry and injury-free, and I’m predicting we’ll see some New Zealand records broken by him in the future.

He’s been especially good against the Asian teams, with 20 wickets against Pakistan at 20.25, 21 wickets against Sri Lanka at 18.38, and 11 against India at 19.09. Considering that the 2023 Cricket World Cup will be hosted in India, that marks him out as one to watch.

Henry doesn’t just threaten records on the smaller scale. He is also threatening Shane Bond’s record of 54 matches for the fastest Black Caps bowler to 100 ODI wickets. Henry has taken 81 wickets in 44 games, meaning he has to take 19 in nine to break the record and 19 in 10 to equal it.

At his current rate of 1.84 wickets per match, Henry will reach the milestone in 55 games, one more than Bond and one fewer than Boult.

Another Shane Bond-related stat is that Henry has a better strike rate – Bond took 29.2 balls per wicket compared to Henry’s 27.9. Bond took four wickets or more 11 times in 82 matches, while Henry has already done so 8 times in only 44 matches. Bond did it once every 7.5 matches, Henry has done it once every 5.5 matches.

In fact, Henry has one of the ten best strike-rates of all time for a bowler who has taken 50 or more ODI wickets. Measured by strike rate, he’s ahead of Waqar Younis, Brett Lee, Shaoib Ahktar and Allan Donald.

The only criticism that one might level at Henry, in comparison to Bond and Boult, is that he is hittable. When people make this argument, they refer to his economy rate of 5.50, which is expensive in comparison to the 5.07 of his contemporary Boult (let alone Bond’s truly excellent economy rate of 4.28). Henry has yet to earn the respect of opposition batsmen playing him out as Bond, Boult and Vettori had.

In any case, I’m not arguing that Henry is an all-time great just yet. Despite the stats and despite his excellent lines and seam movement, he’s certainly not above criticism when it comes to mastery of length. His predictable hit-the-top-of-off approach, while difficult to play effectively, makes it possible to premeditate slogs down the ground or over midwicket.

However, I’m certainly not arguing that Henry is the finished product just yet either. Being only 27 years old, he still has plenty to learn when it comes to canniness and cunning. Although a weapon with the new ball, his bowling at the death has exposed his lack of variations. I am predicting for him to learn these variations and to become a great.

In the end, the fairest way is to rate Henry is according to the standards of his peers.

Since the last Cricket World Cup, Henry is 15th on the list of bowling averages for players from the major nations (minimum 40 wickets). Weighing more heavily is his current ranking in the top 10 of ODI bowlers, reflecting the large proportion of top-order wickets he has taken. If one considers that he was as high as 4th in 2016, the last time he got a consistent run in the side, then it’s already apparent that he’s underrated.

But there’s more. Henry currently sits 43rd on the list of all-time lowest bowling averages for players who have taken 75 or more ODI wickets. His average of 25.60 puts him ahead of Shane Warne, Dale Steyn and Pat Cummins. This century, his average puts him 25th. That’s an excellent return for a player who some think doesn’t deserve a spot in the Black Caps’ starting XI.

By any meaningful statistical measure, the performances that Matt Henry has delivered in the ODI jersey are almost as good as Trent Boult’s. If one considers that Henry’s role in the team is to take wickets with the new ball, then the danger he represents is roughly equal.

All of this is enough to declare him the most underrated player currently in the Black Caps side.

*

Understanding New Zealand, by Dan McGlashan and published by VJM Publishing, is the comprehensive guide to the demographics and voting patterns of the New Zealand people. It is available on TradeMe (for Kiwis) and on Amazon (for international readers).