Is It Time For Drug Licenses?

It’s obvious by now that New Zealand politicians have completely lost all control of the drug laws. From the legal highs circus to the disaster that was the Psychoactive Substances Act to the obstinate refusal to even discuss medicinal cannabis, we all know that they’ve lost the plot.

So when we get rid of them, we might as well get rid of their whole rotten system (founded on lies) and start from scratch, basing our drug policy on scientific evidence instead of the hysteria, primitive superstition and vicious envy that has characterised the standard approach until now.

If we start from scratch, what would our system of drug laws, restrictions and prohibitions look like?

This article suggests that the best model would be to have a system of different classes of license to purchase different classes of drugs.

This would operate much like the current system for licensing of motor vehicles. In the same way that anyone wishing to operate a motorcycle must demonstrate competence in a different set of skills to someone wishing to operate a regular car, so too does anyone wishing to use a drug safely need to understand various sets of skills relating to the class of drug.

For example, tobacco is a very safe drug in terms of how difficult it is to overdose (basically impossible) and how long it takes heavy use to kill you (several decades on average). So getting a license to buy tobacco would be very simple. Probably little more than demonstrating an awareness of the effects of tobacco and how to get help if they feel they are addicted.

Methamphetamine, on the other hand, is not so safe. It is very easy to use methamphetamine in a way that inadvertently leads to health problems.

So getting a license to use recreational methamphetamine might be more like getting a helicopter license – it may take a few years, it may require character references, it may require an absence of prior criminal convictions, it may require that the individual’s methamphetamine use is accounted for by a pharmacist who would notice a creeping addiction etc.

If anything, requiring a license to drink alcohol would make more sense than anything else. For one thing, people already have to prove that they are 18 years of age or older before they can buy alcohol, so having to have an alcohol license would not be an extra hassle.

For another – and this is the major advantage – an alcohol license would make it much easier for the justice system to deal with alcohol-related misbehaviour: simply take the alcohol license away.

Drunk in charge of a motor vehicle? Loss of alcohol license and driver’s license. Drunk and bash someone over the head for a laugh? Loss of alcohol license and a fine or imprisonment. Drinking yourself to death and your GP knows he’s watching you die? Loss of alcohol license and the option of an addiction management course.

As it stands currently, you can get drunk, bash someone, get a suspended sentence because prison for common assault is considered a bit heavy, and then be back on the piss that afternoon.

Curiously, there is already an example of such a thing in Polynesia: alcohol licenses in Tonga.

If one imagines a system in which a person could use basically whatever drug they wanted as long as they could complete a reasonable, objective, intelligently-designed series of tasks that demonstrated competency to use it with a minimum of negative externalities on society, it seems so much better than the stupidity we now have.

It would also bring some respect back for the mental health services, as it is currently impossible to have any when they lie to their patients about the medicinal value of various drugs: it would be impossible to get away with telling such lies under an evidence-based system.

This would also circumvent other problems, such as the potential for drug tourism. People who come on short visits to New Zealand won’t have drug licenses, and Kiwis will be reluctant to use their licenses to buy drugs because, if caught, they would lose them.

Such a system of licensing would make it much easier to correctly respond to societal health and crime problems than the current “destroy the drug user” model.

Understanding New Zealand: Demographics of High-Skill Occupations

This article is a companion to the earlier Voting Patterns of High-Skill Occupations.

Because the sort of person who becomes a manager is the same sort of person who runs everything else in the country, including – and especially – the Government, the demographics of this occupation will tell us a lot about the sort of person who controls the power apparatus in New Zealand.

Predictably, there is a very strong positive correlation between being of European descent and working as a manager – this was 0.54. Also predictably, there was a very strong negative correlation between being a Pacific Islander and working as a manager – this was -0.60.

Some might be surprised to find out that the correlation between being Maori and working as a manager was very close to zero – namely, -0.11. In other words, it was much less strongly negative than the comparable correlation with being of Pacific Island descent.

This reflects a number of things, the foremost being that Maoris are more likely to have the necessary mana to be appointed a manager in the first place.

The ethnic demographics of professionals, by contrast, reflected educational demographics. The correlation between being Asian and working as a professional was 0.37, which reflects the fact that a professional degree is a ticket to move almost anywhere in the world you like, and that many Asians use that ticket to move to New Zealand.

Anyone who has been exposed to a Luciferian conspiracy theory recently might be interested to learn that working in a high-skill occupation is fairly strongly correlated with having no religion. The correlation between working as a manager and having no religion was 0.49, which is extremely strong if one considers that managers tend to be much older than average and that old people are much more religious than average.

The correlation between working as a professional and having no religion was 0.33, also fairly strong if one takes into account that many of the New Zealand professional class are born in highly religious overseas countries or communities (there are positive correlations between working as a professional and being any of Catholic, Jewish, Muslim or Hindu).

The major division in the high-skill group is one of age: managers are much older than professionals, for the obvious reason that the skills needed to become a manager are learned over the course of a career, while the skills needed to become a professional are usually learned before the career begins.

The correlation between median age and working as a manager was 0.43. There was a positive correlation between working as a manager and all age brackets above 30 years of age, which is understandable given that it takes time to learn how to manage a business.

The correlation between median age and working as a professional was -0.15. This was not significant but still shows that the professional class in New Zealand is very young. Mostly this was because the age brackets between 20 and 50 years of age all had correlations stronger than 0.50 with working as a professional.

This is primarily for two reasons. The first is that a recently graduated foreign professional is more strongly advantaged by the immigration system than an older one, and the second is that the tertiary education sector in New Zealand has only recently expanded and so the bulk of Kiwi professionals are only recently trained.

Professionals on average are wealthier than managers, despite being younger. The correlation between net personal income and working as a professional was 0.68, compared to 0.49 for managers.

The disparity is most evident when one looks at specific income bands. For people in the $60-70K income band, the correlations with being a manager and being a professional were about the same: for the former it was 0.54 and for the latter it was 0.56.

It was even stronger for people in the $70-100K income band: the correlation between being in this band and being a manager was 0.49 and for being a professional 0.84. It was strongest of all in the $100-150K income band: the correlation between being in this band and being a manager was 0.41 and for being a professional an extremely strong 0.88.

This tells us that there are proportionately few managers in the very highest income brackets, for the simple reason that this is where the vast bulk of doctors, lawyers, judges, psychologists etc. are.

In other words, becoming a manager is the slow route to the big time, whereas getting a professional degree is the fast route. Nowhere is this more evident than when the correlations with the higher degrees are examined.

The correlations between working as a manager and having an Honours, Master’s or doctorate degree were 0.17, 0.11 and 0.08 respectively. None of these were significant. The corresponding correlations for professionals were extremely strong: 0.93, 0.91 and 0.76.

Perhaps these differences can be explained by a natural intelligence gap. All other things being equal, a person in a high-skill occupation is going to be more intelligent than someone in a non-high-skill occupation. However, the manager class is mostly built up over time from the most suitable of people from the medium-skill occupations, whereas the professional class mostly consists of people who have been identified as specially academically talented since their first years of school.

There may be support for this supposition with a look at the patterns of tobacco smoking. The managerial class had a correlation of 0.44 with being an ex-smoker and a correlation of -0.01 with having never smoked. This suggests that they are the sort of person who is much like anyone else until they get older and find that the health drawbacks of smoking outweigh the psychological benefits.

The professional class, by contrast, had a correlation of 0.59 with never having smoked. As both ex-smokers and people who have never smoked (plus a large number of current smokers) could all tell you, never having smoked tobacco is the smartest option, if you can manage it!

Another notable difference between the two classes is that professionals have a significant positive correlation with being born overseas (0.37), whereas managers are slightly less likely than the average Kiwi to be so (-0.17).

This reflects the fact that it takes so long to work one’s way up to become a manager that it’s far easier to do if you stay in the same country. Professionals have much less in the way of such considerations.

*

This article is an excerpt from Understanding New Zealand, by Dan McGlashan, published by VJM Publishing in the winter of 2017.

The Symbiotic Relationship Between Humans and Cats

The relationship between cats and humans goes back into antiquity

Why do people love cats so crazily much? Is it the cuteness, the companionship, the intelligence, the charm? It could be any of those things, but this article will investigate a cold, scientific proposal: that we love cats because we have evolved to.

It is believed that the cat was domesticated by humans about 6,000 years ago in Egypt. This was far from a fluke.

When semi-nomadic humans decided to invent agriculture and settle down in the Nile Delta, they found themselves faced with a set of survival challenges that simply did not exist in the nomadic world.

The most obvious was the gigantic pile of grain that they had every autumn as a consequence of the harvest. The granaries that held this harvest also held a year’s food supply for the civilisation that controlled it. This meant that securing the granaries was a matter of life and death.

So people built stone walls, metal swords, guard towers etc. and these were very effective at keeping other people away.

The biggest danger to the granaries was not other humans, though – it was rodents. Storing a gigantic pile of food in the middle of a large settlement of people naturally attracted mice and rats from all around.

This meant that effectively keeping mice and rats away from the granaries also became a matter of life and death.

Enter the cat.

The perfect solution to what was at the time an existential problem was found in the form of the Northern African wildcat, from which our domestic cats are descended.

The cats naturally preyed on mice and rats anyway, so it was only a matter of time until someone had the clever idea of taking some kittens into their home in the hope of domesticating them in the same ways that dogs and horses had already been “civilised”.

As anyone who has raised a kitten knows, it would have only been a matter of weeks before the kitten started chasing pieces of string and leaves, and then insects, and then the dreaded rodents.

From this moment onwards, all people capable of agriculture came to take cats into their homes for protection of their food from rodents, as cats did not eat grain themselves. And so, having cats had by this time become a crucial factor that determined one’s ability to live.

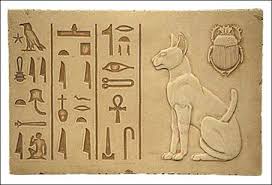
This alone was probably enough for people like the ancient Egyptians to start worshipping cats, and this would explain the curious repetition of cat-related imagery in Egyptian motifs.

The sacred animal status achieved by the domestic cat is probably a result of the survival advantages to humans offered by cats through pest-control

Indeed, the gratitude of humans for their feline protection from rodents was initially so great that the Egyptians founded a holy city of the cat cult in a place called Bubastis. The status of the cat was so high in this culture that if a family’s cat died they could have it buried for free in the great necropolis there.

Since these times, the human population has exploded, at least in part to the initial benefits afforded by the survival advantage of not having rodents eat all of our grain.

The human and the cat might therefore have become inextricably linked. It may now be that, without cats, we couldn’t keep the rodent population low enough for us to maintain our immense population at the number it has swollen to.

It has been argued that medieval religious superstitions linking cats to witchcraft were responsible for anti-cat persecutions that led to an increase in the rodent population that led to the Black Death. So anything that harms cats, harms us.

The meow of the cat is an interesting behaviour that provides more evidence of common evolution between cats and humans, because cats do not meow to each other and they do not meow to other animals. The meow appears to be a form of communication that only exists between cat and human.

It’s possible that cats learned to meow because they evolved to. Perhaps cats that were more vocal were more favoured by humans, and so were fed more often and therefore were more capable of reproducing.

It might also be that the capacity to vocalise emotions in the form of meowing is indicative of intelligence, and that this was selected for in cats in the same way it was in humans – through increased efficiency of behaviour.

Probably the most striking piece of evidence for the common evolution of cats and humans, however, is the incredible fondness that people have for them.

This might also be an evolved behaviour. It’s easy to believe that people who were naturally fond of cats would more easily attract them as companions, and therefore benefit more from the anti-rodent efforts than a person who chased them away.

It is also easy to believe that, given the holy status of cats in some cultures, that anyone who harmed them was dealt to by other humans, and so did not pass cat-unfriendly genes into the next generation.

Unlike the horse, who was partially replaced by the automobile, and unlike the dog, who was partially replaced by remote electronic security, there will probably always be a need for cats for the sake of companionship and pest control.

It may even be that, like in the film Aliens, we take cats with us to the stars.

*

If you enjoyed reading this essay, you can get a compilation of the Best VJMP Essays and Articles of 2017 from Amazon for Kindle or Amazon for CreateSpace (for international readers), or TradeMe (for Kiwis).

Understanding New Zealand: Voting Patterns of Beneficiaries

If the general disenfranchisement rule has applied so far in this study, it could be confidently predicted that the turnout rate of beneficiaries would be considerably lower than average. As it turns out, this is only part of the truth. It turns out that some beneficiaries are much less disenfranchised than others.

Pensioners, for example, are generally very happy to turn out and cast a vote for National. The correlation between receiving a pension and turnout rate in 2014 was 0.51, and between receiving a person and voting National in 2014 it was 0.50. Pensioners were even more likely to vote Conservative in 2014 – the correlation there was a very strong 0.64.

Both of these correlations were much stronger than the correlation between claiming a pension and voting New Zealand First, which was 0.33. Many will find this surprising as New Zealand First is often pigeonholed as the pensioners’ party.

The voting patterns of pensioners reflect genuine old-school conservatism, which is why National, Conservatives and the former National MP Winston Peters do so well among them. This is also reflected in the significant negative correlations between both being a pensioner and voting Green in 2014 (-0.24) and between being a pensioner and voting ACT in 2014 (-0.30).

Perhaps oddly, the Aotearoa Legalise Cannabis Party does better among pensioners than any of the Maori-heavy parties or Labour. The correlation between claiming a pension and voting ALCP was -0.19, which, although negative, is not significant. The reason for this probably is because once a person is of pensionable age they are more likely to suffer the kind of health ailments that could be ameliorated by cannabis, and and therefore more likely to have become aware of its medicinal properties and the benefits of law reform.

The strongest negative correlation with being a pensioner was with voting Labour in 2014, which was -0.53. With voting Maori Party in 2014 it was -0.34 and with voting Internet MANA it was -0.36.

The second least disenfranchised group of beneficiaries were students. Although students are typically stereotyped as disinterested in voting, the correlation between claiming a student allowance and turnout rate in 2014 was only -0.33. Although this is significant, it is much weaker than the correlations for the unemployment and invalid’s benefits.

Above anyone else, Kiwi students love to vote Green. The correlation between claiming a student allowance and voting Green in 2014 was 0.55. This probably reflects the degree of leftist sentiment among middle-class students. The next highest was the correlation between claiming a student allowance and voting Labour in 2014, which was 0.34.

To a major extent, the patterns for the rest of the parties mirrored the fact that students are virtually always on the opposite end of the age spectrum to pensioners.

Thus, there were moderately strong correlations between being a student and voting for any of the Maori-heavy parties, except for New Zealand First. Betwen being a student and voting Maori Party in 2014 the correlation was 0.26, with voting Internet MANA it was 0.29 and with voting ALCP it was 0.17.

New Zealand First was disfavoured by students, but not significantly so – the correlation between claiming a student allowance and voting New Zealand First in 2014 was -0.18.

The two most disfavoured parties by students were, of course, National and the Conservatives. The correlation between claiming a student allowance and voting for the former in 2014 was -0.46 and with voting for the latter it was -0.51.

If students and pensioners can be generally considered middle-class beneficiaries, then invalids and the unemployed can be considered the lower-class ones.

The correlation between turnout rate in 2014 and being an invalid’s beneficiary was -0.53, and between turnout rate in 2014 and being an unemployment beneficiary it was a very strong -0.76. Considering that people in both of these groups have the time to vote, these figures speak of an immense disenfranchisement.

Predictably, then, when they did vote it was not for right-wing parties. If a Kiwi is on the invalid’s benefit, the correlation with them voting National in 2014 was -0.65, and if they were on the unemployment benefit it was a whopping -0.85.

Being on the invalid’s benefit had a correlation of -0.35 with voting for the Conservative Party in 2014 and one of -0.59 with voting for ACT in 2014. Being on the unemployment benefit was almost the precise opposite: a correlation of -0.60 with voting for the Conservative Party in 2014 and one of -0.38 with voting for ACT in 2014.

The party that lower-class beneficiaries like to vote for more than any other is the Aotearoa Legalise Cannabis Party. The correlation between voting ALCP in 2014 and being an unemployment beneficiary is a very strong 0.79, and with being an invalid’s beneficiary it is almost as strong, at 0.76.

The reason for this is that New Zealand’s cannabis laws are little more than a kick in the guts to the already poor, sick and disenfranchised.

The two next favoured parties for lower-class beneficiaries were New Zealand First and Labour. The correlation between being an invalid’s beneficiary and voting New Zealand First in 2014 was 0.69, and with voting Labour it was 0.44. They were slightly stronger for unemployment beneficiaries: between being an unemployment beneficiary and voting New Zealand First the correlation was 0.57, and with voting Labour it was 0.62.

Unemployment beneficiaries and invalid’s beneficiaries were both indifferent to the Greens, further underlying the specific appeal of that party to the middle class. The correlations between being on either benefit and voting Green in 2014 were almost perfectly uncorrelated.

The correlations between being on the unemployment benefit and voting Maori Party in 2014 (0.79) and with voting Internet MANA in 2014 (0.76) were about as strong as for voting for the ALCP. The correlations between being on the invalid’s benefit and voting for these parties was slightly weaker: for the Maori Party it was 0.59 and for Internet MANA it was 0.56.

This reflects the large numbers of Maoris on these two benefits, as well as the fact that invalid’s beneficiaries, who want cannabis for medicine, have a greater interest in cannabis law reform than the unemployed, who often want it as a recreational alternative to alcohol.

*

This article is an excerpt from Understanding New Zealand, by Dan McGlashan, published by VJM Publishing in the winter of 2017.