
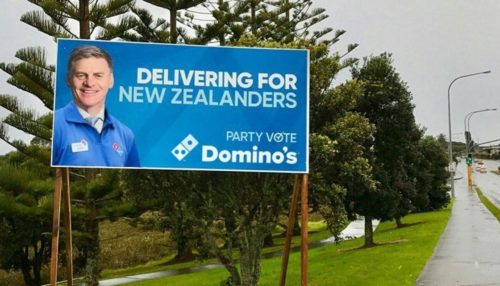
Who Voted For National in 2017

The National Party has the confidence of the rich to deliver

The National Party went from being able to govern with a handful of suppliant support partners after the 2014 General Election to needing the support of Winston Peters after 2017. As Peters has expressed a will to change, this is a much weaker position (and reflects falling to 44.45% support in 2017 from 47.04% in 2014). This article looks at who voted for them this year.

Fundamentally, National is the major conservative party and therefore they want most things to change as little as possible. Their voters are mostly made up of the sort of people who already occupy a reasonably high social position and who want to maintain this by not reducing inequality or redistributing resources.

This would explain why the correlation between voting National and median personal income is so high: at 0.53 in 2014 and 0.49 in 2017. National voters are considerably wealthier than the average Kiwi, and they are wealthier than the voters of any other party except for ACT (the correlation between voting ACT in 2017 and median personal income was 0.61).

Unsurprisingly, then, there is a very strong correlation of 0.63 between living in a freehold house and voting National.

National continues to get support from voters in the wealthier income bands, although these correlations became slightly weaker in 2017. All of the income bands from $60K or above had positive correlations with voting for National in 2017, but there were all marginally weaker than the same correlations in 2014 (from 0.24 to 0.21 for $60-70K; 0.36 to 0.32 for $70-100K; 0.34 to 0.30 for $100-150K; 0.35 to 0.30 for $150K+).

Related to this, one of the strongest correlations with voting for National in 2017 was with being self-employed with employees – this was 0.72. This is strong enough to suggest that anyone self-employed with employees who found themselves voting for a party other than National would have few fellows.

By 2017, the average National voter was fairly likely to be born overseas. The correlation between being born overseas and voting National in 2017 was 0.38, up from 0.33 in 2014. That probably reflects the degree to which National has been chasing specifically Asian voters who might be tempted to vote conservative on account of high wealth and/or low solidarity, and to which Pacific Islander voters switched to them because of religious sentiments around abortion etc.

Maoris, for their part, predictably abstained from the National Party. The correlation between being Maori and voting National in 2014 was -0.75 and in 2017 it was -0.74. Correlations of these strengths can be guessed at from the fact that National scores less than 10% in some Maori electorates.

This tells us that the vast bulk of the change in native-born support for the National Party was from native-born Kiwis of European descent. Indeed, the correlation between being a Kiwi of European descent and voting National fell from 0.60 in 2014 to 0.52 in 2017 – still pretty strong, but not as strikingly so.

From this we can determine that the reduction in support for National among Kiwis of European descent, from very strong to moderately strong, was partially balanced by an increase in pro-National sentiment among Pacific Islanders and Asians. So it follows that the correlation between voting National in 2017 compared to 2014 became more positive for Asians – increasing from 0.09 to 0.16 – and that the correlation between voting National in 2017 compared to 2014 became less negative for Pacific Islanders – weakening from -0.46 to -0.39.

It’s important here to take care not to mislead. The National Party voting bloc might have slightly fewer white people and slightly more Islanders than last time, but the National Party is still very much a pro-European party, and Pacific Islanders still mostly prefer Labour.

At least part of the reason for the increase in Pacific Islander support for National was religious sentiments inclining them towards conservative positions on ever-more present issues like gay marriage and cannabis law reform. We can see that the correlations between voting National and being either a Mormon or a Jehovah’s Witness – two religions with a high proportion of Pacific Islander followers – became less negative towards National: from -0.63 in 2014 to -0.57 in 2017 in the case of Mormons, and from -0.53 in 2014 to -0.49 in 2017 in the case of Jehovah’s Witnesses.

The correlation between voting National and median age fell from 2014 to 2017, from 0.81 to 0.78. This was particularly noticeable in the 50+ age brackets and for being on the pension – the correlations between being in any of these categories and voting National fell from 2014 to 2017.

However, this correlation between age and voting conservative is one of the strongest and most significant in this entire study. Simply getting older is more likely than almost anything else to make a New Zealander become conservative.

Curiously, people with university degrees were less likely to vote National this time around. Although anyone holding a university degree was more likely than not to vote National (ceteris paribus), the correlations between voting National fell for all of them from 2014 to 2017: from 0.25 to 0.22 for a Bachelor’s, from 0.22 to 0.16 for an Honours, from 0.20 to 0.16 for a Master’s and from 0.20 to 0.13 for a doctorate.

The National Party lost a little of its mild South Island bias as well. The correlation between living on the South Island and voting National in 2017 was not significant, at 0.08 (down from 0.13 in 2014). This small change is probably because a lot of the white middle-class grandparents cohort, who are numerous on the South Island, switched away from National to be replaced by Pacific Islanders who live on the North Island.

Managers were the occupation that preferred National more than any other. The correlation between voting for National in 2017 and being a manager was 0.52.

*

This article is an excerpt from the 2nd Edition of Understanding New Zealand, which Dan McGlashan and VJM Publishing will have ready for sale at the end of October 2017. This will contain statistics calculated according to the official final vote counts and will be freshly updated with data from the 2017 General Election.


Who Voted For the Maori Party in 2017 (And Who Didn’t)

The Maori Party made a number of strategic errors over the past decade, and by 2017 the total damage from them had become fatal

When the Maori Party made the decision to support a conservative Fifth National Government, many commentators believed that it would be the death of the party. Indeed, the Maori Party was destroyed at the 2017 General Election, when voters appeared to decide that supporting a conservative government had lowered Maori standards of living. This article looks at who stuck by them and who didn’t from 2014.

Let’s get the most obvious out of the way – there was an extremely strong correlation between voting Maori Party and being Maori. In 2014 this was 0.91, and by 2017 it was slightly weaker, at 0.89. This puts a figure on what we already knew – that the vast bulk of Maori Party voters are Maoris.

In this, and in most other regards, Maori Party voters were very similar to who they were in 2014.

One notable difference is that the Maori Party this year got a fair bit more support from Pacific Islanders. The correlation between being a Pacific Islander and voting Maori Party in 2017 had increased to 0.08 from 0.01 in 2014.

Of course, Pacific Islanders will very seldom be on the Maori Roll and therefore this increased support from them would not have helped the Maori Party win an electorate seat. Indeed, it could even be argued that broadening the Maori Party tent to include Pacific Islanders was one of the main causes of it losing so much support to the Labour Party in 2017.

Considering that the Maori Party won almost as many votes in 2017 (30,580) as it did in 2014 (31,849), it might be that the attempt to broaden their appeal to other ethnic groups, while partially successful, cost them just enough Maori support to mean that they did not win any Maori seats.

This suggestion is backed up by the observation that Maori Party voters were slightly less likely to be New Zealand born in 2017 when compared to 2014. The correlation between the two was 0.62 in 2014 and 0.58 in 2017. Furthermore, the correlation between voting for them and being born in the Pacific Islands became less negative, from -0.19 in 2014 to -0.12 in 2017.

If this is true then it speaks to the string of strategic errors that the Maori Party made. If they gambled their electoral future on public belief in some kind of pan-Polynesian sentiment, they lost everything.

This loss of support to Labour can be seen in microcosm in the education and training industry. The correlation between working in this industry and voting Maori Party fell from 0.38 to 0.34, while it rose in the case of Labour, from -0.01 to 0.15. This means that a person in this industry in 2017 was only slightly more likely to vote Maori Party they were to vote Labour, compared to much more likely in 2014.

It can also be seen with the occupation of community and personal services workers. The correlation between having this occupation and voting Maori Party was 0.64 in 2014, but 0.59 in 2017, whereas the correlations with voting Labour went in the opposite direction – from 0.20 in 2014 to 0.39 in 2017.

So it would seem that a reasonable number of Maori voters in people-focused jobs switched to the Labour Party, and that this was partially compensated for by an increase in Pacific Islander voters.

*

This article is an excerpt from the 2nd Edition of Understanding New Zealand, which Dan McGlashan and VJM Publishing will have ready for sale at the end of October 2017. This will contain statistics calculated according to the official final vote counts and will be freshly updated with data from the 2017 General Election.
Who Voted For the Aotearoa Legalise Cannabis Party in 2017?

The Aotearoa Legalise Cannabis Party may have have won 3,000 fewer votes in the 2017 Election than the 2014 one, but they won more votes than the Conservative Party, four times as many votes as United Future and over half as many votes as the ACT Party. That’s quite a few considering the minimal campaign expenditure. So who voted for the ALCP in 2017, and how were they different to 2014?

The average ALCP voter was fairly hard done by in 2017, slightly worse than in 2014. The correlation between voting ALCP and median personal income was -0.48 in 2017, strengthening from -0.40 in 2014. Also, the correlations between voting ALCP and being in any income band below $50K were all more strongly positive in 2017 than 2014, and were all more strongly negative in 2017 than 2014 for all income bands above $70K.

Part of the reason for this is that many of the voters the ALCP lost from 2014 were the educated, middle-class white ones who ended up voting for TOP. Indeed, it can be seen that this year’s crop of ALCP voters were more poorly educated than last time. All of the correlations with having a university degree and voting ALCP were less strongly negative in 2014 than by 2017 (-0.46 had become -0.51 for a Bachelor’s degree, -0.42 had become -0.49 for an Honours degree, -0.46 had become -0.51 for a Master’s degree, and -0.38 had become -0.45 for a doctorate).

It would seem that the group of ALCP voters that left for TOP between 2014 and 2017 were mostly the same university educated young professionals or students that left the Greens for TOP between 2014 and 2017. This might be little more than 0.1% of voters in the case of shifting from the ALCP, but for a party that small losing them has a big effect.

This means that the ALCP had become a bit less white by 2017. The correlation between being a Kiwi of European descent and voting ALCP fell from -0.15 in 2014 to -0.23 in 2017, while the correlation between being a Pacific Islander and voting ALCP flattened out, from -0.10 in 2014 to -0.00 in 2017. It was even more strongly Maori in 2017 than in 2014: the correlation between being Maori and voting ALCP in the former was 0.91, compared to 0.89 in the latter.

Although there was still a significant correlation between voting ALCP in 2017 and having no religion (0.24), it was a fair bit weaker than the same correlation in 2014 (0.34). This is a fairly distinctive change and gives an idea of the sort of person who switched to the TOP party from 2014.

The ALCP also lost voters in the 30-49 age group. Here the correlation between being of this age group and voting ALCP became more strongly negative: from -0.39 in 2014 to -0.43 in 2017. The ALCP vote fell across the board but even more sharply in this age group than the others. In the 20-29 age group the vote held relatively firm, telling us that what was already a young voting cohort in 2014 got even younger.

All of this explains why there was a strong negative correlation of -0.70 between voting ALCP in 2017 and voting for National in 2017. The ALCP continued to get support from the young, the Maori and the poor – in other words, from those most acutely affected by cannabis prohibition, who are entirely different demographics to those who regularly vote National.

The high amount of Maori support was also reflected in the high correlations between voting ALCP and voting for other parties that have a high level of Maori support. The correlation between voting ALCP in 2017 and voting Maori Party in 2017 was 0.80; with voting MANA in 2017 it was 0.65; with voting Labour in 2017 it was 0.56 and with New Zealand First in 2017 it was 0.40.

Reflecting this, voting for the ALCP had strong negative correlations with voting for parties generally supported by wealthy or old white people. The correlation between voting ALCP in 2017 and voting Conservative in 2017 was -0.40, compared to -0.51 for voting United Future and -0.52 for voting ACT.

Fittingly for a banned substance with immense medicinal value, there are very strong correlations between voting ALCP in 2017 and being on the invalid’s benefit (0.79) and the unemployment benefit (0.82). These were both a little stronger than in 2014, which might suggest that the cannabis law reformers that switched to TOP were more likely to be employed white professionals primarily interested in recreational cannabis, whereas those who remained with the ALCP tended to be on sickness or invalid’s benefits and mostly interested in medicinal cannabis.

*

This article is an excerpt from the 2nd Edition of Understanding New Zealand, which Dan McGlashan and VJM Publishing will have ready for sale at the end of October 2017. This will contain statistics calculated according to the official final vote counts and will be freshly updated with data from the 2017 General Election.

The World That Sober People Built

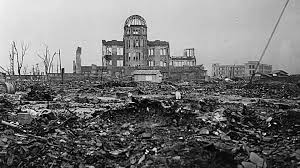
Sober minds built the atomic bomb that fell on Hiroshima; sober minds gave the orders to drop that bomb; sober minds followed those orders

“That person must have been on drugs” is a common response to observing all kinds of wacked-out behaviour, as if taking a psychoactive drug inevitably brings about false kinds of thinking – a cognitive bias this column has previously described as Sobriety Bias Syndrome. But if we look around the world that sober people built, and the moral values agreed upon by sober people, things really didn’t turn out that great.

It was pious and sober people who decided, a few thousand years ago, that mutilating the genitals of baby boys was a legitimate expression of God’s will. It was sober people who decided to adopt this tradition from the foreigners who practiced it, and people are sober when they argue for the “health benefits” of the mutilation.

George W. Bush, completely sober, decided that sending the firepower of the US military after Saddam Hussein’s Iraq was a great idea, even though it led directly to the deaths of over a million people. The US Congress, elected to represent the American people, also soberly decided that this was a great idea.

In the 1930s we created and watched “documentaries” such as Reefer Madness, which exhorted us to tell our children that smoking cannabis will turn them into murderers; a dozen years later, with god-fearing sobriety, we built nuclear weapons and dropped them on Japanese civilians, killing hundreds of thousands in one hit.

These are the actions of sober minds. So clearly a person doesn’t have to be intoxicated in order to do terrible things to someone else.

Far from it. In many ways, sobriety can be seen as a kind of virus. Its presence in a person’s mind tends to work to drive out periods of non-sobriety, usually because of egoistic religious delusions about achieving purity of thought. The sober mind tends to have thoughts repeating in it over and over again, and this repetition can lead to a powerful commitment to some ideas.

This is a fact long understood by television programmers, who appreciate how repeated exposure to a short, powerful stimulus is more likely to induce purchasing behaviour in a potential consumer than a single exposure to e.g. a lecture about the qualities of a product.

Because novel psychoactive experiences tend to destroy this conditioning by allowing the conditioned person to see things from new perspectives, if you want to get everyone marching in lockstep then these psychoactive experiences need to be either discouraged or made illegal.

Consequently, entirely sober people have decided, presumably using sober logic, that putting another human being in a cage is a fair punishment for being caught growing a medicinal plant without permission.

Maybe there’s an argument that too much sobriety makes an individual mean from a lack of levity, and a society dumb from a lack of questioning?

After all, the mass shooters making the front pages recently are definitely not smoking weed, taking ecstasy or tripping on mushrooms or LSD, and neither are the genital mutilators, military warhawks and brainwashers that are responsible for most of the world’s evil.

The truth is that the world needs a diversity of ideas if humans are to survive the challenges of coming years. Never mind a diversity of skin colour – such superficial qualities do not constitute real diversity. Real diversity is diversity of ideas, even outlandish ones, even crazy ones, because that is the kind of diversity that saves us from groupthink and prevents us from making the kind of error that arises from self-righteous conviction about one’s correctness.

To that end, sobriety is our enemy and getting wasted is our friend.