Understanding New Zealand 3: Who Voted National In 2020

The 2020 General Election was a disaster for National. Their vote count collapsed from 1,152,075 (44.4%) to 738,275 (25.6%). This catastrophic result saw National with no chance of negotiating their way into government.

National lost voters in two major directions. Not only did they lose votes to their fellow right-wing party ACT, but they also lost votes across the centre to Labour.

VariableVoting National 2020Voting National 2017
Age 20-24-0.48-0.35*
Age 25-29-0.39-0.35*
Age 30-34-0.250.20**
Age 35-39-0.040.20**
Age 40-440.220.20**
Age 45-490.580.20**
Age 50-540.690.71***
Age 55-590.670.71***
Age 60-640.700.71***
Age 65-690.670.62****
Age 70-740.680.62****
Age 75-790.690.62****
Age 80-840.660.62****
Age 85+0.630.62****

Although National never got many votes from young people (the correlation between voting National in 2017 and being aged 20-29 was significantly negative), they got even fewer in 2020. Young New Zealand voters followed the general trend of drifting away from conservative parties between 2017 and 2020.

One pattern here is very striking: support for National rises as age rises, up until the 50-54 year old age bracket, at which point it levels off. National support increases the most quickly between ages 30-45, because this is the age in which the largest number make the transition from renter to homeowner, and therefore from a victim of the Establishment to a beneficiary of it.

People in the age brackets where homeownership is very high, i.e. those aged 50 or above, are solidly National supporters. The correlation between voting National in 2020 and owning one’s own home in a family trust was 0.81, and with owning or part owning one’s own home outright it was 0.56. The correlation between voting National in 2020 and neither owning one’s home in a family trust nor outright was -0.75.

The reason for this is obvious: National is more interested in taxing labour than capital, so those who own a lot of capital vote National out of self-interest. The New Zealand homeowner can rest assured that the National Party will never impose a capital gains tax nor a land tax. They are very much the representatives of accumulated capital.

The ongoing and worsening housing crisis is probably the foremost reason that National lost many younger voters, but maintained their position among the middle-aged. After all, the more arduous and difficult it is for a young person to get into a house, the more cruisy and luxurious life is for those who own the houses.

VariableVoting National 2020Voting National 2017
European0.530.52
Maori-0.65-0.74
Pacific Islander-0.46-0.39
Asian0.070.16

If National is the party of the Establishment, then they predictably get a lot of votes from white people. In 2020, the correlation between voting National and being of European descent was 0.53. This is strong enough to suggest that the vast majority of National support comes from white people.

Support for National sank noticeably among Pacific Islanders and Asians, however. Asians are almost completely indifferent to National, and Pacific Islanders now dislike National almost as much as Maoris do. It’s possible that National becomes more and more a white person’s party over time.

The Pacific Island voting bloc is an interesting one, because they are torn between voting Labour for economic reasons and voting National for religious reasons. Few appreciate how hotly contested this bloc is. This contention is probably why Labour does not come out in support of cannabis law reform.

VariableVoting National 2020Voting National 2017
Loss or Nil Income-0.45*-0.51
Personal Income $1-$5,000-0.45*-0.58
Personal Income $5,001-$10,000-0.57-0.71
Personal Income $10,001-$15,000-0.29**-0.48
Personal Income $15,001-$20,000-0.29**-0.19
Personal Income $20,001-$25,0000.07***-0.16
Personal Income $25,001-$30,0000.07***-0.33
Personal Income $30,001-$35,000-0.15****-0.36
Personal Income $35,001-$40,000-0.15****-0.42
Personal Income $40,001-$50,000-0.15****-0.25
Personal Income $50,001-$60,0000.32*****-0.01
Personal Income $60,001-$70,0000.32*****0.21
Personal Income $70,001-$100,0000.41******0.32
Personal Income $100,001-$150,0000.41******0.30
Personal Income $150,000+0.41******0.30

The National Party isn’t just the party of those holding wealth, it’s also the party of those earning it. There were significant correlations between voting National in 2020 and having a personal income of over $50,000 per year. The correlation between voting National in 2020 and having a personal income of over $70,000 was 0.41.

Beneficiaries and people in that income range are extremely disinclined to vote National. This is because of the perception, earned during the Bolger and Key Governments, that National is cruel towards non-pensioner beneficiaries. The correlation between voting National in 2020 and having a personal income between $10,001 and $20,000 (i.e. in the non-pensioner beneficiary range) was significantly negative, at -0.29.

The correlations between voting National in 2020 and having a personal income in the pensioner range – between $20,001 and $30,000 per year – were positive. This reflects two things: that National are much more generous towards pensioners than towards other beneficiaries, and that pensioners tend to be more conservative than younger voters, who tend to have less to lose from the status quo.

However, the correlations between being wealthy and voting National were not as strong as the correlations between being old and voting National, and the correlation between earning over $70,000 and voting for a party was stronger for the Greens (0.52) than it was for National. This speaks to the degree to which votes for National are often cast for reasons of social conservatism and not just wealth.

VariableNational Vote 2020National Vote 2017
No religion0.160.02
Buddhism0.120.20
Christianity0.100.33
Hinduism-0.14-0.06
Islam-0.19-0.10
Judaism0.170.20
Spiritualism and New Age-0.16-0.30

On the subject of social conservatism, this has traditionally been where National got a lot of its voters. Christians are generally happy to have homosexuals, prostitutes and cannabis users locked up in prison for moral reasons, and to that end they tend to vote National.

In 2017, the correlation between voting National and being Christian was 0.33. But by 2020 this had fallen to 0.10. Support for National also fell between 2017 and 2020 among Buddhists (0.20 to 0.12), Hindus (-0.06 to -0.14) and Muslims (-0.10 to -0.19). These voters probably didn’t switch because of moral reasons, but because of the poor example National set with their multiple changes of leadership.

Some might be surprised that Jewish support for National is not higher, given that National recently had a Jewish Prime Minister, and that Jews are by far the most economically privileged demographic in New Zealand. The fact is that Jews are so economically privileged that they are more likely to vote ACT than National.

Spiritualists and New Agers tend not to vote National because they see National as the party of materialism and consumerism. The correlation between voting National in 2020 and being a Spiritualist or New Ager was not significant in 2020, while it was significantly negative in 2017.

The positive (if not significant) correlation between voting National in 2020 or 2017 and having no religion might surprise some, given the existing association between National and Christianity.

VariableVoting National 2020Voting National 2017
Voting Labour same year-0.16-0.94
Voting Greens same year-0.16-0.25
Voting ACT same year0.920.61
Voting New Zealand First same year0.070.04
Voting New Conservative same year0.680.45
Voting The Opportunities Party same year0.11-0.20
Voting Maori Party same year-0.71-0.76
Voting Advance NZ same year-0.13n/a
Voting Sustainable NZ same year0.50n/a
Voting ALCP same year-0.60-0.70
Voting TEA Party same year0.21n/a
Voting Heartland NZ same year0.13n/a
Voting Social Credit same year0.19n/a
Voting NZ Outdoors Party same year0.20n/a
Voting ONE Party same year-0.17n/a
Voting Vision NZ Party same year-0.60n/a

In 2017 National and Labour were heavily polarised, and appealed to very different demographics. The correlation between voting National in 2017 and voting Labour in 2017 was -0.94, suggesting that there was very little overlap between the two voting blocs.

By 2020, the correlation between voting National and voting Labour was -0.16. This was because so many elderly, rich, white, Christian voters switched to Labour that there was no longer any significant difference between the voters of the two parties. National was still older, richer, whiter – but not by anywhere near as much.

So many old, rich, white people abandoned National for ACT in 2020 that the correlation between voting for either party in 2020 was 0.92. In 2017 this correlation was only 0.61.

There were also strong correlations between voting National in 2020 and voting New Conservative in 2020 (0.68) or voting Sustainable NZ in 2020 (0.50).

Significant negative correlations existed between voting National in 2020 and voting Maori Party in 2020 (-0.71), voting Vision NZ in 2020 or voting Aotearoa Legalise Cannabis Party in 2020 (both -0.60). These parties have a young, poor and brown demographic and are therefore different to the National-voting demographic in several major ways.

None of the correlations between voting National in 2020 and voting for the other parties in 2020 were significant, which speaks to the degree that National is a middle-of-the-road party with broad-based appeal. Most demographics can appreciate the basic National Party appeal of an orderly society, and so National will always have some amount of support even among traditionally disadvantaged demographics.

VariableVoting National 2020Voting National 2017
Percentage of males-0.020.33

Perhaps most emblematic of National’s failure in 2020 was the collapse in the male vote from 2017.

Conservative parties all around the world can count on a significantly higher level of support among males than females. This is because men, on average, control a significantly higher proportion of both income and wealth. As such, they are inclined against voting for parties that want to tax income and redistribute wealth, i.e. against the social democratic parties.

That there was a negative correlation between being male and voting National in 2020 reflects how incompetent National appeared between 2017 and 2020. In 2017, the correlation between being male and voting National was significantly positive, at 0.33. By 2020 this advantage had been completely lost.

VariableVoting National 2020Voting National 2017
No qualifications-0.22-0.41
Level 1 certificate0.04-0.16
Level 2 certificate-0.13-0.22
Level 3 certificate-0.68-0.24*
Level 4 certificate-0.05-0.24*
Level 5 diploma0.010.75**
Level 6 diploma0.800.75**
Bachelor’s degree0.160.22
Honours degree0.200.16
Master’s degree0.110.16
Doctorate0.070.13

National likes to present itself as the party of the elite, which they are in a limited sense. However, their eliteness is mostly limited to wealth, and not education.

There were no significant positive correlations between voting National in 2020 and having any of the university degrees. The closest was between voting National in 2020 and having an Honours degree, at 0.20.

This finding might surprise those who are used to thinking of National voters as the natural intellectual elites. National voters are the natural ruling class, because they’re the ones that inherit money and connections, and the ruling class are those who inherit money and connections, not the most intelligent.

The best-educated people, in fact, tend to vote ACT (if male) and Greens (if female).

The correlations between having a Bachelor’s, Master’s or doctorate degree and voting National in 2020 all weakened from 2017. To lose these demographics is to lose the true elite, those who are distinguished by their intellectual contribution to the culture. It’s also to lose the most reasonable people in the centre.

VariableVoting National 2020
Own house in family trust0.81
Own or part-own house0.56
Neither ownership nor family trust-0.75

As some could guess from their opposition to restrictions on landlords, National is very much the landlords’ party. It’s not surprising, then, that there was an extremely strong correlation between owning a house in a family trust and voting National in 2020. 0.81 is one of the strongest of all correlations between any demographic variable and voting National in 2020.

If people owning a house in a family trust can be considered the upper-middle class, those who own or part-own a house outright might be considered the middle-middle class. There was a correlation of 0.56 between being in this category and voting National in 2020. Landowners, then, are the core National Party demographic.

If society can be crudely divided into the owners and the owned, those who have to labour to pay rent are the owned. The difference between being a feudal-era serf and having to work 15-20 hours a week to pay rent is not obvious to the person doing the work. Few people in this category want to maintain the status quo.

As such, those who don’t own property are extremely unlikely to vote National. There was a correlation of -0.75 between neither owning property outright nor in a family trust and voting National in 2020.

VariableVoting National 2020
Income from wage or salary-0.47
Income from self-employment or own business0.74
Income from interest, dividends, rents or other investments0.71

If National are the party of ownership, it would follow that their supporters tend to make money from owning things. Indeed, the correlation between receiving an income from interest, dividends, rents or other investments and voting National in 2002 was 0.71.

Receiving an income from a wage or salary had a correlation of -0.47 with voting National in 2020. Unfortunately this category was not separated into income from a wage and income from a salary, because this would have given us some very useful information. In any case, it’s clear that those who have to work don’t like to vote National and those who don’t have to work do like to vote National.

Receiving an income from self-employment or one’s own business and voting National in 2020 had a correlation of 0.74. Unfortunately, also, this category was not separated into income from self-employment and income from passively owning a business. Many self-employed are tradesmen and would vote Labour because of working-class sentiments, so those who own their own business must be among the strongest National supporters of all.

VariableVoting National 2020
Managers0.78
Professionals0.09
Technicians and Trades Workers0.05
Community and Personal Service Workers-0.61
Clerical and Administrative Workers-0.01
Sales Workers-0.18
Machinery Operators and Drivers-0.43
Labourers-0.29

That National is the party of those with power, and not so much the party of those with brains, is further underlined by looking at which professions voted for them in 2020.

The occupation with the strongest support for National, by far, were managers. Being a manager had a correlation of 0.78 with voting for National in 2020. If you have people underneath you who you need to manage, National is your party. This is because of previous pro-employer National measures, such as the Employment Contracts Act.

The correlation between being a professional and voting National in 2020 (0.09) was barely strongly than the correlation between being a technician or trades worker and voting National in 2020 (0.05). This demonstrates the degree to which National doesn’t appeal to those running the country, just to those owning it.

Community and personal service workers were the occupation with the strongest negative correlation with voting National in 2020 (-0.61). This is mostly because this is an occupation that requires high levels of empathy, and National has been known for cruelty ever since the welfare reforms of the Third National Government (a.k.a. Ruthanasia).

Traditional working-class occupations were significantly negatively correlated with voting National in 2020. This was true of both labourers (-0.29) and machinery operators and drivers (-0.43). As with other demographics, this can be readily explained by the fact that National prefers to tax income than wealth, which disadvantages those in working-class occupations.

*

This article is an excerpt from the upcoming 3rd Edition of Understanding New Zealand, by Dan McGlashan and published by VJM Publishing. Understanding New Zealand is the comprehensive guide to the demographics and voting patterns of the New Zealand people.

*

If you enjoyed reading this essay, you can get a compilation of the Best VJMP Essays and Articles of 2019 from Amazon for Kindle or Amazon for CreateSpace (for international readers), or TradeMe (for Kiwis). A compilation of the Best VJMP Essays and Articles of 2018 and the Best VJMP Essays and Articles of 2017 are also available.

*

If you would like to support our work in other ways, please consider subscribing to our SubscribeStar fund. Even better, buy any one of our books!

Is The Fiat Currency System Collapsing?

BitCoin enthusiasts have been overjoyed in recent months to observe the rise of their favourite cryptocurrency against the US Dollar. The price of BitCoin recently touched USD40,000 earlier today, making predictions of an eventual six-figure value seem believable. But the good news for BitCoin holders might herald bad news for everyone else. This could be the collapse of the fiat currency system.

The rise in the price of BitCoin has to be understood in the wider economic context.

Ever since the Global Financial Crisis of 2007, Western governments have taken to what is known as quantitative easing. This involves the widespread printing of fiat currency, a practice that has seen the price of everything go up. New Zealand recently increased the Quantitative Easing limits to $100 billion, up from $60 billion, meaning that the Reserve Bank of New Zealand will help to fund the Government through buying bonds.

Almost 24% of all US Dollars in existence have been created over the past 12 months. This money printing has led to a much greater supply of money in circulation, which means one thing: inflation. The fiat currencies of the world are rapidly becoming worthless. This is evident when comparing their value to housing, bullion and BitCoin.

In New Zealand, the average house price has doubled since 2009, but wages have only gone up 40% since then. The average house cost ($330,000/$25) 13,200 hours of labour at the average wage in 2009. By 2020, it cost ($700,000/$34) 20,600 hours. So measured in house-buying terms, the average wage has lost 50% of its power since the Global Financial Crisis.

This is despite that fact that the value of housing stock has served as a kind of heat sink that has taken the steam out of the economy. That sink has now absorbed all the energy that it can. The extra is manifesting as inflation.

The rise in the price of silver bullion is even more striking. Silver bullion has doubled in value since April 2020. The reason for this is mostly uncertainty around fiat currency (the last time silver bullion spiked was in the immediate aftermath of the Global Financial Crisis). Silver has traditionally been seen as an alternative to fiat currency owing to its millennia of trade use.

It’s a similar story with gold bullion, the price of which has tripled since the Global Financial Crisis.

Most striking of all is the price of BitCoin. At the time of writing this article, the price of BitCoin had gone up 30% over the previous week. It had gone up 500% over the previous nine months. BitCoin has gained fame as a digital alternative to fiat currency, owing to the fact that it is not under centralised control.

Many people have predicted that BitCoin will take over once the fiat currency system collapses completely. It will be evident when this is happening, apparently, from a sustained spike in the BitCoin price. Well, there’s a spike in the BitCoin price right now, as well as a spike in the silver price, the gold price and the house price.

All of these trends point unmistakably to one conclusion: the fiat currency system is collapsing. This isn’t surprising to those who were already aware of the life cycle of fiat currencies. Soon, fiat currencies might be worth so little that some people refuse to take them in trade. Then the shit will hit the fan.

*

If you enjoyed reading this essay, you can get a compilation of the Best VJMP Essays and Articles of 2019 from Amazon for Kindle or Amazon for CreateSpace (for international readers), or TradeMe (for Kiwis). A compilation of the Best VJMP Essays and Articles of 2018 and the Best VJMP Essays and Articles of 2017 are also available.

*

If you would like to support our work in other ways, please consider subscribing to our SubscribeStar fund. Even better, buy any one of our books!
Neil Wagner And The Coming Golden Age Of New Zealand Cricket

Black Caps fans were disappointed to hear, last Sunday evening, that Neil Wagner had broken two toes batting in the first innings in the ongoing Test against Pakistan. The natural assumption was that the damage would prevent Wagner from bowling, and so the Black Caps were much less likely to win the match than they otherwise would have been. As it turned out, Wagner bowled 49 overs anyway, and the Black Caps won by 101 runs.

The win against Pakistan was important for a number of reasons. For one thing, it propelled the Black Caps to the No. 1 Test ranking for the first time in their history. For another, it meant that they still had a chance to make the World Test Championship final. But the main reason was spiritual.

There are many reasons why the All Blacks are infamously hard to beat. Their extremely high level of skill is one. The main reason, though, is will. The All Blacks go harder than any other team barring the Springboks. They and the Boks seem ready and willing to die to defend their line, a quality shared by no other teams. The All Blacks are even willing to play on with broken bones.

On the 1970 All Blacks tour of South Africa, Colin Meads played most of a match against East Transvaal with a broken arm. The near-demonic will necessary to do this has since become part of the All Blacks mythology. In the half-century since that tour, the All Blacks have built a winning record against every other side in the world, even the 3-time World Cup winning Springboks.

Part of the reason why the All Blacks are so good is their “aura”. This is the name given to the All Blacks egregore, which is powerful enough to influence games in its own right. This egregore has gained so much power because of feats like that of Colin Meads. Other teams don’t have players willing to play on with broken bones, which is why they keep losing to the All Blacks, who do.

When most Black Caps fans heard that Neil Wagner had two broken toes, they would have resigned themselves to a draw. Tim Southee, Trent Boult, Kyle Jamieson and Mitchell Santner are fine bowlers, but it seems unlikely that they could take 20 wickets by themselves on a placid New Zealand pitch that would continue to flatten out.

That Wagner not only continued to bowl, but took 4-105, is a feat equal to that of Colin Meads half a century ago. Wagner has rightly been lauded for his influence on the outcome of the match, but the larger effect might be Wagner’s influence on the Black Caps’ egregore. The Black Caps are, now, also a team that fields players willing to play on with broken bones.

Wagner’s feat, and the subsequent Black Caps victory, may have created an egregore that is strong enough to win matches on its own. Every team that faces the Black Caps now knows that, as Wagner put it, their opponents would rather be carried off on a stretcher than lose. That is intimidation. That is an aura. That fact will create doubt in the minds of every team that gets ahead of the Black Caps in a match.

It’s also impossible to overstate the psychological effect that the Black Caps win will have on world cricket. The bar has now been set higher than ever before. Every cricketer in the world knows that, if they aren’t willing to bowl 49 overs on a broken foot, they don’t want it as much as the Black Caps do. Net bowlers the world over will tire and, thinking of Wagner, bowl for another hour anyway.

Thanks to the efforts of Wagner and others, the Black Caps are now the world’s leading cricket team.

What seems clear is that the Black Caps are about to enter the true Golden Age of New Zealand Cricket. From now until at least the retirement of Kane Williamson, the Black Caps will either be ranked No.1 or will be threatening it. They have a cadre of both batsmen and bowlers who will be able to perform at world-class level, and there won’t be mass retirements for at least one more World Cup cycle.

Over the next four to six years, the Black Caps will challenge in all conditions against all opponents. That they themselves believe they can do this has been ensured by Neil Wagner’s efforts this week. Both the Black Caps and their opponents know that not even broken bones are enough to stop the Kiwi pace battery. It will provide an invincible confidence.

This Black Caps side is already the No. 1 Test team in the world and easily the best squad that New Zealand has ever produced. The big question is whether they have what it takes to challenge Ponting’s Australia as the most complete side in living memory. The next four to six years should tell us.

*

If you enjoyed reading this essay, you can get a compilation of the Best VJMP Essays and Articles of 2019 from Amazon for Kindle or Amazon for CreateSpace (for international readers), or TradeMe (for Kiwis). A compilation of the Best VJMP Essays and Articles of 2018 and the Best VJMP Essays and Articles of 2017 are also available.

*

If you would like to support our work in other ways, please consider subscribing to our SubscribeStar fund. Even better, buy any one of our books!

Clown World Chronicles: Generational Relations In Clown World

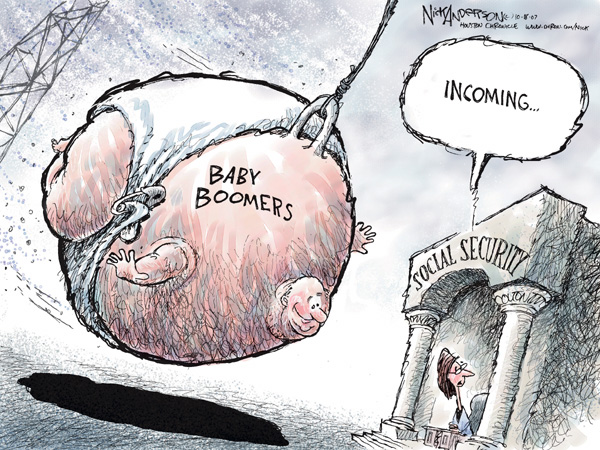
All kinds of relations are bad in Clown World, but generational relations are at their lowest point ever. Instead of the difficulty that marked generational relations in the past, today there is hate. This hate is based on the fact that one generation in particular – the Baby Boomers – are chiefly responsible for Clown World and for its perpetuation.

The social contract, ever since the start of human civilisation, was that each generation prizes and nurtures its young so that, when those young are adults, they can take care of the elderly. This contract worked successfully for hundreds of generations. Each cohort of elderly people, upon observing their children, could take pride at the quality of life they left for those following.

The Boomers were the first generation to break this contract. Thanks to their unprecedented levels of godlessness, the Boomers decided that they had to indulge every possible desire during this life. And so they spent up large, whether by cash or on credit. Even their descendants’ credit was spent.

Instead of acting to preserve the wealth they inherited, so that their offspring could enjoy it, the Boomers squandered it on material possessions and crude pleasures. They became the first generation in history to leave less wealth to their descendants than they inherited from their predecessors. This is the main reason why generational relations are so bad in Clown World today.

In Normal World, elderly people put aside wealth they don’t need so that their children and grandchildren can escape poverty. In Clown World, Boomers vote themselves luxurious pensions that their children and grandchildren have to labour to pay for. Generational relations in Clown World are analogous to a war that the Boomers won 20 years ago. Since then, they have been enforcing their terms.

Boomers are happy to cut funding to any sector of society if it means more for them. Young people who, because of growing up in Clown World, have developed a mental illness that prevents them from working, are given less to live off than Boomers who already own their own homes. Other young people, struggling to start families, are given less assistance than Boomers give to refugees.

The result: in Clown World, generational relations are marked by hate and accusations of neglect and ingratitude.

The archetypal Boomer invention is the reverse mortgage. Thanks to the invention of this financial device, the descendants of many Boomers will inherit next to nothing. The bank gets the property, and the Boomers spend the rest. Like the grandmother in Dostoevsky’s Gambler, they just piss the money up the wall and let their kids go begging.

Nowhere is this more obvious than with national debts. The Boomers started getting their fingers on the national pursestrings around the turn of the century. At this time, the American national debt was less than $6 trillion. After two decades of Boomer stewardship, the American national debt is now over $26 trillion. The Boomers just ticked up luxury on the national credit card and left it for the younger generations to pay off.

Boomer mismanagement of the economy has led to Millennials having much less wealth than the generations before them. The average Boomer in 1989 had four times as much wealth as people of the same age today. By 2020, most of them have inherited from their WWII-era parents and are living it large. They don’t care if any of this largesse is left for the coming generations.

This has led to the Boomers becoming known as the Parasite Generation. They have purposefully set out to take as much from the following generations as they possibly could, and to give back as little as they possibly could.

The younger generations resent this immensely, but are so far too timid to do anything about it. Few speak of revolution, at least not seriously. The plan seems to be to wait 20-25 years for the Boomers to die off en masse. By then, hopefully, normal relations will restore themselves between Generation X, the Millennials and following generations.

The Boomers seem to have become as selfish as they are for two major reasons.

The first reason is because they, themselves, are heavily damaged. The Boomers were the first generation whose parents and grandparents were both World War veterans. This means that they were the first to be raised entirely by severely traumatised people who, quite naturally on account of the suffering they endured, put themselves first.

The prewar generations were too busy dealing with the psychological damage caused by the World Wars to raise the Boomers properly. The Boomers were, consequently, emotionally neglected. Most of them internalised this example and decided it was natural. So they neglected their own children in turn.

The second reason is spiritual. The Baby Boomers are a cohort of spiritually undeveloped beings. Very few believe in God; very few care about the possibility of incarnating in a place of torment after the death of one’s body in this world. The vast majority of them believe this world is all there is, so gimme gimme gimme now now now.

This widespread spiritual ignorance has convinced the Boomer that there is no punishment for misdeeds in this life. The Earth is a free-for-all, where one is permitted to indulge any desire one wishes at anyone else’s expense, and when the physical body dies the moral ledger is wiped clean. So selling the future of the younger generations, for the sake of comfort now, is not morally unconscionable for those born before 1964.

That generational relations are terrible can, given all this, be predicted.

When the Boomers start dying off, it will be a great relief to the younger generations. Quality relations between young and old will return when Clown World ends, and this is extremely unlikely while the Boomers still call the shots. Barring sudden support for a Day of the Pillow-style move, it’s probably at least 20-25 years away.

*

This article is an excerpt from Clown World Chronicles, a book about the insanity of life in the post-Industrial West. This is being compiled by Vince McLeod for an expected release in January 2021.

*

If you enjoyed reading this essay, you can get a compilation of the Best VJMP Essays and Articles of 2019 from Amazon for Kindle or Amazon for CreateSpace (for international readers), or TradeMe (for Kiwis). A compilation of the Best VJMP Essays and Articles of 2018 and the Best VJMP Essays and Articles of 2017 are also available.

*

If you would like to support our work in other ways, please consider subscribing to our SubscribeStar fund. Even better, buy any one of our books!