

Category: new zealand
Understanding New Zealand: Demographics of Industry

Some stereotypes are true; others are not. One of those that is not true is that Maoris dominate all working-class industries. Although (as described elsewhere) many working-class industries and occupations are heavily populated by Maoris, this isn’t the full story.
The correlation between working in the agriculture, forestry and fishing industry and being of European descent (0.37) was stronger than the correlation between working in that industry and being Maori (0.22). Part of the reason for this is the number of family-run farms, especially on the South Island, that are run by Pakeha.
Working in the mining industry was also much more strongly correlated with being of European descent (0.25) than with being Maori (0.08). This is a consequence of that a large proportion of the Maori population lives in Auckland and thus far from where most of the mining takes place.
Being Maori did have significant positive correlations with a number of generally working-class industries, in particular transport, postal and warehousing (0.47), manufacturing (0.44), education and training (0.43), electricity, gas, water and waste services (0.42) and administrative and support services (0.37).
One point to note here is that these industries are not so much working class as they are people-focused. It might be that much of the association between being Maori and being working class is because many people-focused jobs happen to be working class ones and Maori gravitate towards people-focused jobs.
The correlations with median personal income give us a good indication of which industries in New Zealand are the best paid.
The strongest positive correlations between median personal income and working in a particular industry were 0.76 for professional, scientific and technical services, 0.69 for financial and insurance services, 0.54 for information media and telecommunications and 0.49 for rental, hiring and real estate services.
The strongest negative correlations between median personal income and working in a particular industry were -0.40 for manufacturing, -0.29 for transport, postal and warehousing, -0.23 for agriculture, forestry and fishing and -0.15 for mining.
The negative correlations were weaker than the positive ones for the reason that anyone in gainful employment – in any industry – is almost guaranteed to be wealthier than all beneficiaries and the majority of pensioners.
The correlations with education reflected that the highest paying industries were also the ones that generally required the greatest degree of previous training and therefore education.
The strongest of all was the correlation between working in scientific, technical and professional services and having a Master’s degree – this was 0.94. There is nothing suprising about this because often a Master’s degree minimum is necessary for a professional job.
The correlations between working in a particular industry and being born in New Zealand are interesting because they can tell us what sort of person is most likely to successfully get through our immigration system. Because our immigration system prioritises the sort of person who has a skill that New Zealand has a shortage of, these people will be disproportionately many in some industries.
Foremost of these was scientific, technical and professional services. The correlation between working in this industry and being born in New Zealand was -0.47, which tells us that a fair number of these workers have moved here from overseas.
The correlation between being born in New Zealand and working in financial and insurance services was even more strongly negative, at -0.56. The main reason for this is probably because the bulk of this industry in New Zealand is based in Auckland and that’s also where most foreign-born people are.
Many of the people who own their own farms work at home in a family business. This is evident from the strong positive correlation between working at home and working in the agriculture, fishing and forestry industries, which was 0.81, and the very strong positive correlation between working unpaid in the family business and working in the agriculture, fishing and forestry industries, which was 0.90.
One trend that makes sense if considered from an economic psychology perspective is that the better paid a person’s job is, the more likely they are to work full time.
The industries that had the strongest positive correlation with working full-time were professional, scientific and technical services (0.52), financial and insurance services (0.48) and information media and telecommunications (0.44).
There are several reasons for this, but the major one is that anyone of a mind to learn the skills necessary to do jobs in these industries are usually also of a mind to work full-time and to earn as much money as possible during this time.
The other major one is that anyone with the capital to employ a person with these skills is likely to be a serious operator and consequently will be looking to get full productivity out of their employees.
Perhaps the best way to determine which industries are the best paid are to see which of them have the strongest correlations with high income bands.
The industries that had the strongest correlations with low income bands were hospitality in the $5-10K band; mining in the $15-20K band; healthcare and social assistance in the $20-25K band; agriculture, forestry and fishing in the $25-30K band; electricity, gas, water and waste services in the $30-35K band; and manufacturing and transport, postal and warehousing in the $35-40K band.
These are the industries for people who are generally doing it hard. The jobs are not well paid, and they are insecure, and they are often seasonal. Usually they are also jobs that have a high turnover (hospitality is particularly well known for this).
Where jobs are more stable, regular and predictable, we can also see a rise in which income band their workers belong in.
The industries that had the strongest correlations with medium income bands were construction and retail trade in the $40-50K band; administrative and support services in the $50-60K band; education and training in the $60-70K band; and wholesale trade, public administration and safety and arts and recreation services in the $70-100K band.
Construction is arguably the top of the working class industries, because even though the majority of the labour is manual it involves very high amounts of capital. The other five industries in this group (leaving aside retail trade) are the start of the knowledge industries, in that they generally demand a higher level of prior education.
The industries that had the strongest correlations with the high income bands were information, media and telecommunications, finanical and insurance services and professional, scientific and technical services at $100-150K, and rental, hiring and real estate services at $150K+.
In other words, if a New Zealander works in any of these industries, the odds are that they have a six figure salary. This is because these industries all, like construction, involve gigantic amounts of capital, but unlike construction they are knowledge industries and the workers in these industries are in higher demand and shorter supply.
Rental, hiring and real estate services involves not only big money but employees that work on a commission and not a salary. This explains why working in this industry has its strongest correlation with the highest income band.
*
This article is an excerpt from Understanding New Zealand, by Dan McGlashan, published by VJM Publishing in the winter of 2017.
An Essay Concerning Who Ought to Take the Crease at the Fall of a Wicket in T20s
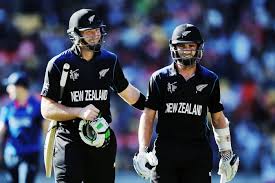
When ODI cricket was invented, it took players, coaches and strategists a while to adapt to the fact that they were no longer playing Test cricket. For example, the fact that 220/3 after 50 overs is great in Tests and terrible in ODIs was not immediately appreciated.
The first ever Cricket World Cup match was famously marred by an innings of 36 off 174 balls from Sunil Gavasakar, who went on to state that “I wasn’t overjoyed at the prospect of playing non-cricketing shots and I just got into a mental rut after that.”
Gavaskar’s Test record shows that he was an exceptionally capable batsman, so the initial adjustment to such concepts as “scoreboard pressure” and “required run rate” must have been a big one, and a psychological one.
It was solved when it was realised that strike rate is about as important as average runs scored for an ODI batsman, especially the closer the game gets to the last over.
T20 cricket is still new enough that original plays are still being thought up. Every year there are new innovations, or new variations on old ones. Some concepts have to be abandoned, some concepts have to be tweaked, and some concepts have to be synthesised out of wordless intuition and perception.
This essay suggests one radical concept: that we need to do away with the old concept of batting order, and to replace it with a batting dynamic.
The major advantage of thinking in terms of a batting dynamic is that it would help the Black Caps find a place in the T20 side for Ross Taylor, who is simply too good to be left out.
A batting dynamic means no longer having a batting order in terms of openers, a first drop, a middle order etc. It means (to simplify it) to have one accumulator and one hitter at the crease at all times.
The reasons for this are mathematical. It’s better to have one accumulator than two hitters, because the hitters can lose wickets in clumps very easily and cripple the team. But it’s better to have one hitter than two accumulators, because you only have 20 overs and batting too slowly will lose you the game just as surely as losing a pile of wickets.
It’s best to consider these to be entirely separate skills – which they are, until the real slog of the last few overs.
The Black Caps have made it to No. 1 in the world T20 rankings partially by opening the batting with who are at time of writing both in the top 8 in the world – Kane Williamson at 3 and Martin Guptill at 8.
In doing so, they have a world-class accumulator in Williamson and a world-class hitter in Guptill, so all is good.
The problems arise when the first wicket falls.
Under the old concept of a batting order, this wouldn’t matter much, as it seldom does in Tests and hardly matters in ODIs.
But when the first wicket falls in a Black Caps T20 innings, the team runs the risk of making two mistakes, namely having two accumulators or two hitters at the crease.
The concept of a batting dynamic means that we divide the batsmen into accumulators and hitters, and that we try not to have two of both until the last few overs when everyone hits.
So for the T20 side, one might open with Kane Williamson and Martin Guptill, with Williamson the designated accumulator and Guptill the designated hitter.
If Williamson is dismissed early, we send Ross Taylor in. This way, it becomes less likely that the opposition will run through our lineup, as happened in February this year.
Conversely, if Guptill is dismissed first, the next hitter in line comes in to bat – perhaps Colin Munro, Corey Anderson, Tom Bruce, Colin de Grandhomme or even Tim Southee.
It doesn’t matter who it is, as long as they have a licence to hit, because the emphasis is on avoiding having two accumulators at the crease. This way we can avoid burning through the overs while scoring too few boundaries and using up our 20 with piles of wickets in hand.
So if Kane Williamson carries his bat, then Ross Taylor will not take the crease until all the other hitters are out. This means that Taylor could bat anywhere between 3 and 7 depending on the hitting ability of the other batsmen and when Williamson is dismissed.
But if Williamson is out on the first ball then Taylor comes in to ensure that the strike is always rotated to the hitter at the other end.
The worst case scenario (besides being bowled out) is that all our hitters get dismissed and we’re left with Williamson and Taylor to finish the innings. Obviously this is still an excellent outcome.
The other point is that if we aim to always have one of Williamson or Taylor at the crease until the death (let’s say until the 15th over at least), then the choice of the other batsmen in the team becomes much more straight-forward: they can simply all be hitters, as it’s very unlikely that Williamson and Taylor will both get out early.
Statistically, one would expect this to have the effect of causing the Black Caps to win by smaller margins, but to win more games, as the variance of the scores will be reduced if there are fewer hit-and-miss batsmen at the crease.
– DAN McGLASHAN
Understanding New Zealand: Demographics of Asian New Zealanders

The main reason why Asian immigration to New Zealand has been the polar opposite to Muslim immigration to Europe in terms of its success and how happy the locals are with it can be seen by the demographics of the group. In particular, the Asians moving here are considerably wealthier, better educated and more middle class – the sort of person that is most likely to make a positive contribution to those around them.
The demographics of Asian New Zealanders, like the voting patterns of this group, are primarily characterised by the fact that the majority are immigrants or descendents of relatively recent immigrants, and as such had to pass the relatively stringent points system.
For example, the correlation between being Asian and being born overseas is an extremely strong 0.91. This tells us that the vast majority of Asians living here were born overseas. The correlation between being Asian and being born in North East Asia was 0.87, but the correlation between being Asian and being born in the Pacific Islands was also fairly strong, at 0.51.
This tells us that, although the bulk of Asians in New Zealand are from China, Hong Kong, Taiwan, South Korea and Japan, there are also many South Asians, and even a fair number of Fijian Indians who are here.
The Asians that do come here certainly do so with higher educations (as mentioned above, this helps them pass the points system). The correlation between being Asian and having a university degree was 0.64 for a Bachelor’s, 0.41 for an Honours, 0.60 for a Master’s and 0.28 for a doctorate.
Interestingly, these figures are not especially indicative of higher earning. The correlation between being Asian and net median income was only 0.22, positive but not significant. This is curious considering that being Asian had a significant positive correlation with either of the two highest income bands: with $100-150K it was 0.32 and with $150K+ it was 0.28.
The reason for this might be that Asians, despite the stereotype of the Chinese slumlord, have not accumulated enough wealth to move into the rentier class yet – a class that is dominated by Kiwis of European descent and Maoris.
It may also be that Asians are much less likely than other Kiwis to live in a family where both parents are working, and that this lowers the average. Although the correlation between being Asian and earning $150K+ was 0.28, the correlation between being Asian and living in a family with an income of $150K+ was only 0.10.
There was a significant negative correlation between being Asian and living in a freehold house (-0.34) and a significant positive one between being Asian and living in a rented house (0.26). There is also a significant negative correlation between being Asian and being self-employed with employees (-0.31) and a significnat positive one between being Asian and working as a professional (0.37).
This group of correlations tells the story of Asians moving to New Zealand recently with professional educations and working professional jobs, but not having been here long enough to become old money and make investment income.
Correspondingly, there are strong correlations between being Asian and working in knowledge-intensive industries and none with either capital or labour-intensive industries.
The correlations between being Asian and working in a particular industry were 0.62 with financial and insurance services, 0.57 with wholesale trade, 0.50 with information media and telecommunications and 0.48 with professional, scientific and technical services.
That Asians tend to be middle-class can be seen from the positive correlation between being Asian and never having smoked tobacco: a very strong 0.77. As anyone who has been to Asia knows, this statistic is far from representative of the people who live there, which suggests that the sort of Asian that emigrates to New Zealand is a cut above their fellows.
The strongest correlation in this entire study – even stronger than the correlation between being Maori and voting Maori Party – is the correlation between being a Buddhist and an Asian – an immensely strong 0.95. This tells us that no matter how trendy Buddhism might be among certain Westerners in Nelson, Grey Lynn and Khandallah, the vast majority of New Zealand Buddhists are Asians who were born into it.
*
This article is an excerpt from Understanding New Zealand, by Dan McGlashan, published by VJM Publishing in the winter of 2017.