Understanding New Zealand: Demographics of Employment Status

Knowing about the category of person who is self-employed with employees tells us a lot about the sort of person who has most of the power in New Zealand at the moment.

This sort of person has more power than anyone because they can legally cause more disruption than anyone. No politician cares too much if a single individual threatens to leave the electorate, but if an employer threatens to relocate their company with its 200 jobs then a politician will suddenly care very intently.

Surprisingly, there is no particularly strong difference between those who work for a wage or salary, those who are self-employed, and those who are self-employed with employees when it comes to median personal income.

These three groups have correlations of between 0.54 and 0.41 with median personal income, with the self-employed the strongest and the self-employed with employees the weakest.

However – as this section seeks to illuminate – holding political power is not merely a function of wealth, although wealth is a contributing factor.

There were very strong correlations between being of European descent and both being self-employed (0.58) and being self-employed with employees (0.70). This relates to the point made above about the power in an economy being held by a sort of person who was not necessarily the same as those who made the money.

Pacific Islanders were the least likely to be in either of those two categories. The correlation between being a Pacific Islander and being self-employed was -0.50, and with being self-employed with employees it was -0.61.

Being Maori was also negatively correlated with being in these categories of employment status: -0.44 with being self-employed and -0.36 with being self-employed with employees.

This reflects the fact that Islanders generally have less social capital than Maoris, despite often being better educated, and that Islanders generally have less financial capital than Asians, despite often having moved to New Zealand earlier and being more culturally established.

Anglicans comprise a large proportion of the power elite, as can be seen by the correlations between being Anglican and being self-employed (0.40) and being Anglican and being self-employed with employees (0.58).

This latter correlation is strong enough to tell us that Anglicans have a lot of political power in New Zealand through occupying essential positions in industry.

Other religious orientations with the strongest correlations with being self-employed with employees were Presbytarianism (0.45), having no religion (0.37) and Brethren (0.22).

These four groups: Anglicans, Presbytarians, those from no religious tradition and the Brethren, comprise the true power elite of New Zealand. The reason for this is because it is these people who own everything: generally they are directly descended from early settlers and owners of large farms.

Here it is possible to further illuminate the distinction within the highly-skilled occupations between the managers who run everything and the professionals they depend on to get things done.

Certain religious traditions had positive correlations with working for a wage or salary but negative correlations with being self-employed with employees.

Catholicism was the most notable of these. The correlation between being Catholic and working for a wage or salary was 0.30, with being self-employed it was -0.23 and with being self-employed with employees it was -0.31.

Other religious traditions which had positive or near neutral correlations with working for a wage or salary but negative correlations with being self-employed with employees were Buddhism (0.11 versus -0.24, respectively), Hinduism (-0.03 versus -0.44) and Islam (-0.03 versus -0.49).

Ultimately these statistics reflect how these latter traditions have higher proportions of recent immigrants who, despite often being highly educated and earning good money, have not had the time to establish themselves as part of the power elite. These immigrants often moved to New Zealand because their high skills were needed by the landowners and managers who were more established.

It’s also possible to observe the fault lines of a generational conflict between the Baby Boomers, whose education is patchy, and Generation X and the Millennials, who generally have modern educations but who are yet to dislodge the deeply entrenched Boomers.

The correlation between having a Master’s degree and working for a wage or salary was 0.33, and with being self-employed with employees it was actually negative, at -0.02. This latter correlation is incredible if one also considers that the correlation between having NZQA Level 1 (School Certificate) as one’s highest qualification and being self-employed with employees was 0.22.

Explaining much of this comes down to the fact that establishing oneself as a member of the power elite is more a function of age than of education.

The correlation between median age and being self-employed with employees was a strong 0.71, whereas with working for a wage or salary it was -0.37. This tells us that, over and above just about anything else, the power elite is old, and the people they hire to do their bidding are young.

To take a more granular perspective, the correlation between being aged 65+ and being self-employed with employees was 0.56, which is interesting if one considers that any person in this age bracket can also claim a pension of $350+ per week which is not means tested.

This is not just a function of greed, of course: realistically, many of the people running a company, especially if it’s one they own, cannot simply give up all of their responsibilities at one moment.

Generally they employ the under-50s. The correlation between being in the 20-29 age bracket and working for a wage or salary was 0.37, and between being in the 30-49 age bracket and working for a wage or salary was 0.52.

The power elite is also much more likely to be male than female. The correlation between being male and working for a wage or salary was 0.11, but the correlation between being male and being self-employed with employees was 0.50.

This isn’t simply a matter of male nepotism: the correlation between being male and doing unpaid work in the family business was 0.48. The truth is that it is in the nature of Kiwi men to work, and the vast majority of us would rather work than just sit around or have nothing to do.

The last point about the power elite that might not be well understood is the degree to which it is intergenerational, especially in the case of farming interests.

Some light can be shed on how strong this degree is by consideration of the correlation between working in agriculture, forestry and fishing and doing unpaid work in the family business, which was an extremely strong 0.90.

*

This article is an excerpt from Understanding New Zealand, by Dan McGlashan, published by VJM Publishing in the winter of 2017.
How Individualism Defends the Anglosphere

In the aftermath of the Great Depression, a couple of extremely virulent and aggressive political movements swept the Western world – communism and national socialism – eventually leading to the deaths of some 50 million people. How did the Anglosphere avoid getting sucked up in these murderous, psychopathic insanities?

The soul-grinding deprivation of the Great Depression caused horrific trauma all around the world. Perhaps on account of an absence of historical guidance and precedent, a number of countries voted extremists, demagogues or lunatics into power on the grounds that desperate times called for desperate measures.

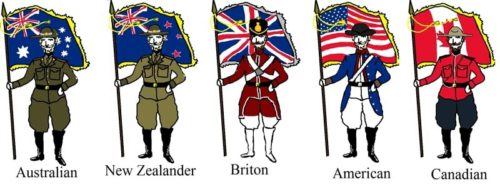
But none of the core Anglosphere nations of Britain, America, Canada, Australia or New Zealand came close to voting a totalitarian into power before World War Two, and none of them have since.

As the European Theatre of World War Two dawned, there seemed to be three major forces. The central powers, represented by Germany, Italy, Austria and Romania, were fascist; the eastern powers, represented by Russia, were communist; and the western powers, represented by the British Empire, America, France, Holland and Scandinavia, were liberal democracies.

The liberal democracies won, and won an opportunity to reshape the world in their image in the coming decades – which they mostly seized.

But ninety years after the streets of Europe were once filled with running battles between communists and national socialists, it looks like they’re going back to the same stupidity.

So why didn’t the Anglosphere put a totalitarian in power before World War Two, and why aren’t we going to put one in power in the coming decade, as the inexorable laws of demography push Europe closer to civil war?

There is a different culture in the Anglosphere. Namely: we are not a slave race, and so we do not tremble in worship before power. In fact, almost uniquely in the world (along with Holland and Scandinavia), we openly express contempt for those who wield it.

Because of this, we don’t get swept up in mass movements and personality cults like the Europeans. There is no concept in the Anglosphere of awaiting some great leader to free us from a terrible and unfortunate state of disgrace, such as which put Hitler in power. Neither is there the kind of entrenched, systematic corruption that leads to the mass resentment of the wealthy that puts Marxists in power.

In fact, if anyone stands up with even vaguely Hitler-like rhetoric, that person is immediately shut down for being a crackpot. There’s no way that you can stand on a street corner and rant about Jews without getting jeered at or having garbage thrown at you.

The trajectory of the British Union of Fascists was much different to that of the Nazi Party: “As the party became increasingly radical, however, support declined. The Olympia Rally of 1934, in which a number of anti-Fascist protestors were attacked, isolated the party from much of its following.”

Even at the apogee of British fascism, The Battle of Cable Street, a maximum of 3,000 fascists were met by 20,000 counter-demonstrators. They were even outnumbered two to one by the Metropolitan Police, which made them, at peak strength, orders of magnitude weaker than the Sturmabteilung in Germany.

And no fascist movement in America, Canada, Australia or New Zealand became anywhere near as strong as the BUF.

There seems to be an inherent wisdom in the Anglosphere consciousness that is capable of recognising massively dangerous egos and imposing a kind of order upon them before they become capable of doing too much damage. It is not in our nature to grovel before a big man; our nature is pulling the fingers, flipping the bird, saying “fuck you”.

It seems to be the natural gift of the Anglo people to keep order without the need for totalitarianism – perhaps a function of having the right amount (not too much, not too little) of diversity of thought, much like the Swedes with their lagom or the Dutch with their famous tolerance, care is taken to act with the correct proportionality.

This is probably a combination of the concept of fair play, which prevent anyone from falling too far down, and the concept of the tall poppy syndrome (Swedish: Jantelagen), which prevents anyone from developing a disruptively large ego.

Anglos generally don’t brook shadowy, sinister conspiracies like other Westerners, and are prone to instantly reject ideologies that require that human nature fundamentally be reshaped, believing in almost all cases that such a thing is simply not possible.

This column has long predicted that natural demographic laws will force Europe into a kind of civil war when Muslims in Europe realise they have the numbers to enforce their religious proscriptions on the natives. This will probably lead to the coming to power of another tyrant, because it is the nature of Europeans to swing from one extreme to another.

Whether the Anglosphere will shed the blood of its young men another time to put the European continent to order is another consideration.

Understanding New Zealand: Demographics of Education

Most people have a vague idea that education is for intelligent people who want to increase their human capital and how to leverage it more effectively, and that educated people more or less run everything. For these reasons, education correlates fairly closely with being part of the Establishment.

Many will be surprised to read that there are no significant positive correlations with being of European descent and having any of the university degrees. Two of them are even negative: the correlation between being of European descent and having a Bachelor’s degree is -0.03, and with having a Master’s degree it is -0.02.

The correlations between being of European descent and having an Honours degree or a doctorate were 0.16 and 0.22, respectively.

This is explainable by the fact that surprisingly few graduates in New Zealand were born here.

The correlation between being born in New Zealand and having a Bachelor’s degree was -0.61; with having an Honours degree it was -0.45; with having a Master’s degree it was -0.59 and with having a doctorate it was -0.32.

One can predict from this that the correlations between being Maori and having a university degree are significantly negative, and indeed they all are stronger than -0.40.

Because our immigration system makes it easier for people who have university degrees to come to New Zealand, we can see that the Pacific Islander and Asian populations – a large proportion of which were born overseas – are much better educated than most people might realise.

Pacific Islanders in New Zealand are much less likely than Kiwis of European descent to have an Honours or a doctorate degree, but the correlation between being a Pacific Islander and having a Bachelor’s degree is only -0.10, and with having a Master’s degree it is only -0.08.

Asians, for their part, are much, much more likely than the average Kiwi to have a university degree. The correlation between being Asian and having a university degree was 0.28 for a doctorate, 0.60 for a Master’s degree, 0.41 for an Honours degree and 0.64 for a Bachelor’s degree. All of these are significant.

The correlaton between being born in North East Asia and having a Bachelor’s degree was a very strong 0.72.

Looking at the correlations between belonging to certain income bands and having a certain educational level underlines the degree to which an education is the ticket to social advancement in New Zealand.

The correlations between having no academic qualifications and being in any of the income bands between $10-40K were all over 0.70. Having no academic qualifications also had correlations of 0.84 with being a regular tobacco smoker, 0.76 with being on the invalid’s benefit, 0.57 with being a single parent, 0.57 with being on the unemployment benefit and -0.68 with net median income.

So by a variety of measures, it’s clear that a person’s level of academic qualifications are generally a pretty good indicator of where they stand in socioeconomic terms.

There were already significant improvements in socioeconomic standing for Kiwis who only went as far as NZQA Level 3 or 4.

Having NZQA Level 3 or 4 as one’s highest academic qualification had correlations of -0.26 with being a regular tobacco smoker, -0.21 with being on the invalid’s benefit, -0.07 with being a single parent, 0.05 with being on the unemployment benefit and 0.12 with net personal income.

These are already vastly better statistics, and the step up from finishing high school to having a university degree is just as great as the step from having no academic qualifications to finishing high school.

Having an Honours degree as one’s highest academic qualification had correlations of -0.64 with being a regular tobacco smoker, -0.55 with being on the invalid’s benefit, -0.49 with being a single parent, -0.39 with being on the unemployment benefit and 0.72 with net personal income.

It’s evident, therefore, that a higher education is extremely strongly correlated with general well-being. The ultimate cause of this might well be natural intelligence, which is of course out of the scope of this study. However, in so far as education correlates with intelligence, we can make an educated guess at the habits of educated New Zealanders by looking at education.

Interestingly, the correlations between education levels and religion spanned the whole spectrum. Some religious traditions in New Zealand are exceptionally well eduated on average; others exceptionally poorly.

The best educated are the Buddhists and the Jews. The correlation between being Buddhist and having no qualifications was -0.72, with having NZQA Level 3 or 4 it was 0.43 and with having an Honours degree it was 0.52. The correlation between being Jewish and having no qualifications was -0.70, with having NZQA Level 3 or 4 it was 0.42 and with having an Honours degree it was 0.76.

Catholics are the next best educated religious demographic, which is a reflection of the large proportion of Catholics that were born overseas and had to get through the immigration system. The correlation between being Catholic and having no qualifications was -0.32, with having NZQA Level 3 and 4 it was 0.19 and with having an Honours degree it was 0.31.

Curiously, the next best educated demographic were of those who had no religious affiliation, and the bulk of these people were born in New Zealand. This might not surprise any readers who are materialist atheists, because this sort of person dominates the universities of this nation.

The correlation between having no religion and having no qualifications was -0.08, with having NZQA Level 3 and 4 it was 0.15 and with having an Honours degree it was 0.27. It may be that a fair proportion of these people were born into a religious family but then came to reject their faith after exposure to university culture.

The average New Zealander who identifies as a Christian has a significantly poorer education than the average New Zealander. The correlation between being a Christian and having no qualifications is 0.15, with having NZQA Level 3 and 4 it was -0.34 and with having an Honours degree it was -0.30. Probably this is a reflection of the fact that there are a fixed number of hours in the day to read books and so reading the Bible must necessarily come at the opportunity cost of reading non-fiction.

The most poorly educated, however, are Mormons and Jehovah’s Witnesses – probably a reflection of the predatory and aggressive proselytising culture of these movements.

The correlation between being a Mormon and having no qualification was 0.40, with having NZQA Level 3 or 4 it was -0.04 and with having an Honours degree it was -0.40. The correlation between being a Jehovah’s Witness and having no qualification was 0.74, with having NZQA Level 3 or 4 it was -0.41 and with having an Honours degree it was -0.71.

*

This article is an excerpt from Understanding New Zealand, by Dan McGlashan, published by VJM Publishing in the winter of 2017.
Understanding New Zealand: Conservative Party Voters

The Conservatives are a strange sort of movement. In many ways they appear to be some kind of rump movement of people who didn’t like it when National decided to move into the 21st century.

The strongest correlation between voting Conservative in 2014 and voting for another party in 2014 was with National – this was 0.77. This is strong enough to suggest that many Conservative voters would have been former National voters, or would have been severely tempted to vote National in 2014.

National was the only party to have a significant positive correlation with voting Conservative in 2014.

There were two parties that were close to uncorrelated. The correlation between voting Conservative in 2014 and voting New Zealand First in 2014 was 0.01, and with voting ACT it was 0.13.

The former of these is probably because both movements compete for the angry, scared old person vote, and the latter is probably because both movements share an indifference towards the poor.

Voting for any of the left-wing parties had significant negative correlations with voting for the Conservative Party in 2014, further emphasising the degree to which the Conservative movement appeals (and is intended to appeal) to disaffected National voters.

The correlation between voting Conservative in 2014 and voting Greens in 2014 was -0.42, and with voting Aotearoa Legalise Cannabis Party it was -0.54. This pair involved slightly weaker correlations than for the other three parties, primarily because Green and ALCP voters are closer to middle aged.

The correlation between voting Conservative in 2014 and voting for the Labour, Maori or Internet MANA parties were -0.63, -0.64 and -0.64 respectively.

Age is the main reason for the strong negative correlations between voting Conservative and any of these parties. The correlation between voting Conservative in 2014 and median age was 0.75, which means Conservative voters are almost as old as National voters.

Conservative voters are even more likely to be on the pension though. The correlation between voting Conservative in 2014 and being on the pension was 0.64, compared to a correlation of 0.50 between voting National in 2014 and being on the pension.

Conservatives are also less educated than average. Whereas the correlations for voting National in 2014 and having any of the university degrees were all positive and either significant or bordering on it, the correlations for voting Conservative in 2014 and having any of the university degrees were all negative and bordering on significant.

Females are less unlikely to vote Conservative than they are to vote National. The correlation between being female and voting Conservative in 2014 was -0.19, compared to a correlation of -0.35 between being female and voting National in 2014.

One major way the two differ is with respect to wealth. The average National voter is much wealthier than the average Conservative one. The correlation between net median income and voting Conservative in 2014 was only 0.06, compared to National’s 0.53.

In fact, looking at the correlations with income bands tells us that wealth is the major differentiator between Conservative and National voters.

The income band that had the strongest positive correlation with voting Conservative in 2014 was the $20-25K band, which was 0.17. All of the correlations between voting Conservative in 2014 and any income band above $25K were negative (although they were all very weakly correlated; not close to significant).

By contrast, all of the correlations between voting National in 2014 and any income band above $60K were positive and significant.

One of the largest differences was that with median family income. The correlation between median family income and voting National in 2014 was 0.42; for voting Conservative it was -0.08.

Oddly, although the average Conservative was more likely than the average National voter to be a Christian, these tended to belong to denominations that were less part of the establishment than the National voters.

The correlation between being a Christian and voting Conservative in 2014 was 0.37, compared to 0.29 for voting National in 2014.

Conservatives, though, were much more likely to belong to the Brethrens. The correlation between being a Brethren and voting Conservative in 2014 was 0.54, compared to 0.25 with voting National in 2014.

Conservatives were also much more likely to be Mormons, Jehovah’s Witnesses, Ratana, Pentecostalists or “Christian not otherwise defined” than National voters, who were more likely to be Anglicans, Presbytarians or Catholics.

Also, the average National voter is slightly less likely to be religious, whereas the average Conservative is slightly more likely to be religious.

The average Conservative is also less likely than the average National voter to be a Kiwi of European descent. The correlation between being of European descent and voting Conservative in 2014 was 0.46, compared to 0.60 between being of European descent and voting National in 2014.

All of this suggests that the main Conservative constituency is those who are like National Party voters in many demographic ways, but who do not have the same level of wealth or social status. It could even be that there is a degree of resentment among them because they are often both old and poor.

*

This article is an excerpt from Understanding New Zealand, by Dan McGlashan, published by VJM Publishing in the winter of 2017.