Receiving income from interest, dividends, rent, other investments
0.825
Voting ACT 2020
0.807
Level 6 diploma
0.734
Voting National 2020
0.692
Receiving income from self-employment or owning one’s own business
0.682
Own or part own house
0.679
Aged 55-59
0.674
Aged 60-64
0.655
Aged 75-79
0.654
Aged 70-74
0.653
Aged 85+
0.647
Aged 65-69
0.641
Aged 80-84
0.639
Receiving income from NZ Super or Veteran’s pension
0.636
Aged 50-54
0.630
Voting The Opportunities Party 2020
0.625
Own house in family trust
0.623
Not studying
0.587
Currently partnered
0.572
Working as a manager
0.562
Two children
0.560
Aged 45-49
0.541
Voting Sustainable NZ 2020
0.529
Voting New Conservative 2020
0.524
Employed part-time
0.523
Married (not separated)
0.493
Following no religion
0.482
Personal income $70,000+
0.453
Mean age
0.441
Honours degree
0.419
Doctorate
0.416
Median age
0.404
Voting Greens 2020
0.385
Special voting Yes for euthanasia
0.366
Voting Social Credit 2020
0.338
Three children
0.337
Following Spiritualism or a New Age religion
0.326
Mean personal income
0.305
Divorced/separated/widowed
0.304
Working as a professional
0.296
Personal income $50,000-$70,000
0.282
Voting NZ Outdoors Party 2020
0.277
Voting Labour 2020
0.275
Master’s degree
0.270
Aged 40-44
0.265
Median personal income
0.261
Percentage of voting age population enrolled
0.259
Working in rental, hiring or real estate services
0.250
Working in professional, scientific or technical services
0.246
Following Judaism
0.222
Working in agriculture, forestry or fishing
0.202
Bachelor’s degree
0.197
Working in arts or recreation services
0.194
Working in other services
0.192
Personal income $20,000-$30,000
0.162
Working in public administration or safety
0.156
Working in mining
0.138
Working in healthcare or social assistance
0.117
Voting New Zealand First 2020
0.101
Employed full-time
0.097
Working in financial or insurance services
0.088
Voting Heartland NZ 2020
0.061
Working in accommodation or food services
0.054
Percentage of females in electorate
0.044
Working in retail trade
0.039
Percentage of electorate overseas-born
0.032
Working in education or training
0.030
Working in information media or telecommunications
0.028
Working as a technician or trades worker
0.014
Level 1 certificate
0.010
Not in the labour force
0.006
No children
-0.026
Voting ONE Party 2020
-0.032
Percentage of electorate New Zealand-born
-0.032
Working in construction
-0.035
Percentage of males in electorate
-0.044
Aged 35-39
-0.069
Part time study
-0.080
Living in an urban electorate
-0.093
Working in electricity, gas, water or waste services
-0.094
Level 2 certificate
-0.095
Level 4 certificate
-0.099
Following Buddhism
-0.100
Receiving income from ACC or private work insurance
-0.126
Working as a clerical or administrative worker
-0.139
Aged 30-34
-0.154
Voting Advance NZ 2020
-0.161
Special voting Yes for cannabis
-0.169
Receiving wage or salary
-0.187
Personal income $30,000-$50,000
-0.188
Asian
-0.198
Following Christianity
-0.198
Four children
-0.213
Receiving income from Student Allowance
-0.215
Aged 25-29
-0.231
Personal income $10,000-$20,000
-0.234
Voting TEA Party 2020
-0.238
Level 5 diploma
-0.252
Aged 20-24
-0.259
Following Hinduism
-0.290
Working in wholesale trade
-0.295
Working as a labourer
-0.299
No NZQA qualifications
-0.301
Following Islam
-0.320
Living in a North Island electorate
-0.326
Working as a community or personal services worker
-0.326
Working as a sales worker
-0.352
One child
-0.385
Receiving income from Supported Living Payment
-0.386
Working in manufacturing
-0.404
Personal income $5,000-$10,000
-0.432
Level 3 certificate
-0.487
Voting ALCP 2020
-0.524
Never married
-0.538
Currently unpartnered
-0.572
Five children
-0.580
Object to answering how many children
-0.590
Full time study
-0.611
Working as a machinery operator or driver
-0.614
Following a Maori religion
-0.620
Pacific Islander
-0.628
Working in administrative or support services
-0.664
Maori
-0.666
Voting Vision NZ Party 2020
-0.677
Receiving no source of income
-0.688
Enrolled in a Maori electorate
-0.690
Voting Maori Party 2020
-0.690
Working in transport, postal or warehousing
-0.692
Personal income < $5,000
-0.701
Six or more children
-0.739
Receiving income from Jobseeker Support
-0.744
Receiving income from Sole Parent Support
-0.771
Unemployed
-0.774
Neither ownership of house nor house in family trust
-0.786
*
This article is an excerpt from the upcoming 3rd Edition of Understanding New Zealand, by Dan McGlashan and published by VJM Publishing. Understanding New Zealand is the comprehensive guide to the demographics and voting patterns of the New Zealand people.
Receiving income from ACC or private work insurance
0.699
Percentage of electorate New Zealand-born
0.695
Voting Advance NZ 2020
0.684
Level 2 certificate
0.636
Unemployed
0.635
Five children
0.620
Working as a labourer
0.589
Six or more children
0.583
Personal income $10,000-$20,000
0.581
Working as a community or personal services worker
0.566
No NZQA qualifications
0.550
Receiving income from Supported Living Payment
0.550
Level 1 certificate
0.545
Level 4 certificate
0.528
Voting Vision NZ Party 2020
0.513
Four children
0.507
Never married
0.482
Full time study
0.443
Currently unpartnered
0.393
Voting New Zealand First 2020
0.381
Level 3 certificate
0.375
Working as a machinery operator or driver
0.370
Level 5 diploma
0.365
Working in construction
0.364
Working in transport, postal and warehousing
0.352
Following Spiritualism or a New Age religion
0.347
Personal income $20,000-$30,000
0.332
Voting ONE Party 2020
0.329
Neither ownership of house nor house in family trust
0.320
Following no religion
0.285
Working in manufacturing
0.268
Working in agriculture, forestry or fishing
0.257
Working in electricity, gas, water and waste services
0.255
Personal income $5,000-$10,000
0.249
Special voting Yes for cannabis
0.233
Personal income $30,000-$50,000
0.229
Working as a technician or trades worker
0.206
Working in mining
0.201
Mean age
0.167
Divorced/separated/widowed
0.161
Three children
0.154
Median age
0.149
Working in administrative and support services
0.134
Voting NZ Outdoors Party 2020
0.134
Employed part-time
0.116
Part time study
0.106
Percentage of males in electorate
0.070
Working in healthcare and social assistance
0.040
Working in other services
0.033
Receiving income from Student Allowance
0.029
Voting Social Credit 2020
0.022
Working in accommodation or food services
0.020
Working in retail trade
0.016
Personal income < $5,000
0.011
Receiving wage or salary
-0.003
Aged 20-24
-0.008
Working in public administration or safety
-0.016
Voting Heartland NZ 2020
-0.025
Not in the labour force
-0.032
Working in arts and recreation services
-0.038
Living in a North Island electorate
-0.039
Pacific Islander
-0.052
Receiving no source of income
-0.057
Working in education or training
-0.064
Percentage of females in electorate
-0.071
European
-0.080
Aged 25-29
-0.089
Working as a sales worker
-0.138
Own or part own house
-0.186
No children
-0.192
Receiving income from NZ Super or Veteran’s pension
-0.193
One child
-0.202
Voting Greens 2020
-0.228
Aged 65-69
-0.230
Employed full-time
-0.249
Aged 55-59
-0.250
Aged 30-34
-0.250
Mean personal income
-0.255
Aged 70-74
-0.261
Voting Labour 2020
-0.269
Aged 60-64
-0.274
Median personal income
-0.275
Aged 75-79
-0.301
Special voting Yes for euthanasia
-0.312
Voting New Conservative 2020
-0.312
Working as a manager
-0.313
Voting The Opportunities Party 2020
-0.338
Working in wholesale trade
-0.338
Aged 80-84
-0.338
Receiving income from self-employment or owning one’s own business
-0.345
Following Christianity
-0.352
Personal income $50,000-$70,000
-0.358
Working as a clerical or administrative worker
-0.359
Working in information media and telecommunications
-0.369
Two children
-0.380
Working in rental, hiring and real estate services
-0.383
Voting TEA Party 2020
-0.383
Living in an urban electorate
-0.388
Currently partnered
-0.393
Following Judaism
-0.395
Aged 85+
-0.403
Following Islam
-0.405
Voting Sustainable NZ 2020
-0.406
Aged 35-39
-0.410
Aged 50-54
-0.410
Following Hinduism
-0.414
Not studying
-0.431
Aged 40-44
-0.433
Doctorate
-0.445
Working in financial or insurance services
-0.446
Aged 45-49
-0.465
Percentage of voting age population enrolled
-0.470
Own house in family trust
-0.472
Voting ACT 2020
-0.476
Working as a professional
-0.478
Working in professional, scientific or technical services
-0.490
Personal income $70,000+
-0.513
Turnout rate
-0.524
Master’s degree
-0.529
Asian
-0.530
Honours degree
-0.550
Level 6 diploma
-0.557
Bachelor’s degree
-0.564
Following Buddhism
-0.566
Receiving income from interest, dividends, rent, other investments
-0.580
Voting National 2020
-0.597
Married (not separated)
-0.606
Percentage of electorate overseas-born
-0.695
*
This article is an excerpt from the upcoming 3rd Edition of Understanding New Zealand, by Dan McGlashan and published by VJM Publishing. Understanding New Zealand is the comprehensive guide to the demographics and voting patterns of the New Zealand people.
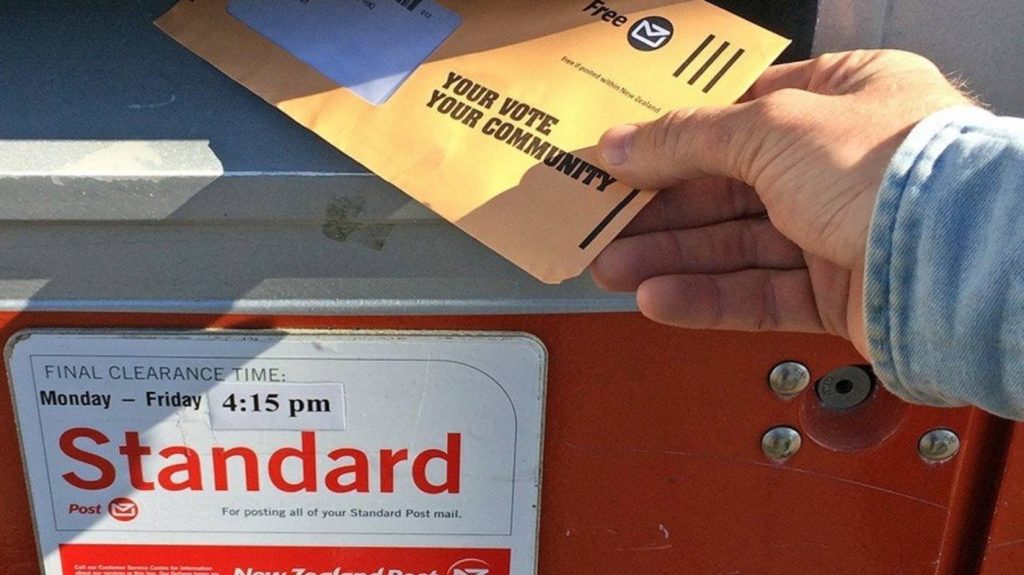
The final chapter of this book answers the question of which demographics turned out to vote in the 2020 General Election. In total, 2,919,073 people cast a party vote, out of 3,549,580 eligible voters, for a turnout rate of 82.24%. This was higher than in 2017, breaking the usual trend of declining turnout rates in Western democracies.
Turnout rate is very closely related to general disenfranchisement, hence the General Disenfranchisement Rule. As we can see in the analysis below, it’s possible to tell who is running society from the extent of their engagement in the political system. The higher the turnout rate, the higher the engagement, the more power and influence.
Variable
Turnout rate 2020
Voting Labour 2020
0.28
Voting National 2020
0.69
Voting Greens 2020
0.39
Voting ACT 2020
0.81
Voting New Zealand First 2020
0.10
Voting New Conservative 2020
0.52
Voting The Opportunities Party 2020
0.63
Voting The Maori Party 2020
-0.69
Voting Advance NZ 2020
-0.16
Voting Sustainable NZ 2020
0.53
Voting ALCP 2020
-0.52
Voting TEA Party 2020
-0.24
Voting Heartland NZ 2020
0.06
Voting Social Credit 2020
0.34
Voting NZ Outdoors Party 2020
0.28
Voting ONE Party 2020
-0.03
Voting Vision NZ 2020
-0.68
Perhaps more than any other measure, the correlations between party affiliation and turnout rate reveal who the true ruling class of New Zealand is. Those who turn out to vote are those psychologically engaged with the political system. They are those with a reasonable expectation that a politician might listen to them.
The top tier by this measure are ACT, National and The Opportunities Party. The correlation between turnout rate in 2020 and voting ACT in 2020 was 0.81; with voting National in 2020 it was 0.69; with voting The Opportunities Party in 2020 it was 0.63. These voters comprise society’s insiders – the wealthy and influential. They are the people who are in charge almost no matter what the political system is.
Immediately underneath them are New Conservative, Greens and Labour voters. The correlation between turnout rate in 2020 and voting New Conservative in 2020 was 0.52; with voting Greens in 2020 it was 0.39; with voting Labour in 2020 it was 0.28.
New Conservative voters are old and old people have very high turnout rates (see below). Greens voters are young but are usually from wealthy families and are usually well-educated. The significant positive correlation between turnout rate in 2020 and voting Labour in 2020 is harder to explain. In truth, Labour voters are part of the political Establishment.
The three parties whose supporters were least likely to turn out to vote were the Maori Party, Vision NZ and the ALCP. The correlation between turnout rate in 2020 and voting Maori Party in 2020 was -0.69; with voting Vision NZ it was -0.68 and with voting ALCP it was -0.52. It’s not news that Maori people tend to be disenfranchised, and all three of these parties have a high proportion of Maori voters.
Variable
Turnout rate in 2020
No NZQA qualifications
-0.30
Level 1 certificate
0.01
Level 2 certificate
-0.10
Level 3 certificate
-0.49
Level 4 certificate
-0.10
Level 5 diploma
-0.25
Level 6 diploma
0.73
Bachelor’s degree
0.20
Honours degree
0.42
Master’s degree
0.27
Doctorate
0.42
It’s well understood that the more educated someone is, the more enfranchised they tend to be. Educated people can express themselves in agreeable and persuasive ways, and tend to be more influential thereby. People with university degrees are heavily over-represented in Parliament, even among Labour Party MPs.
Therefore, it’s not surprising to see significant positive correlations between having any of the postgraduate university degrees and turnout rate in 2020.
It might be surprising to see that the correlation between having a Bachelor’s degree and turnout rate in 2020, while positive, was not significant. After all, a large proportion of the managerial class have that qualification. But the explanation is simple: most people with degrees are young, and young people tend not to vote (see below).
There was a significant negative correlation between turnout rate in 2020 and having no NZQA qualifications (-0.30). Many would have expected this to be stronger, but people in the older age groups are much more likely to have no NZQA qualifications than people in the younger age groups, balancing out the fact that older age groups are more likely to vote.
Variable
Turnout rate in 2020
Aged 20-24
-0.26
Aged 25-29
-0.23
Aged 30-34
-0.15
Aged 35-39
-0.07
Aged 40-44
0.27
Aged 45-49
0.54
Aged 50-54
0.63
Aged 55-59
0.67
Aged 60-64
0.65
Aged 65-69
0.64
Aged 70-74
0.65
Aged 75-79
0.65
Aged 80-84
0.64
Aged 85+
0.65
The origin of the widespread dislike of Boomers can be noted in the table above. Old people are far more likely to turn out than younger ones. Even taking into account the fact that people under 18 can’t vote, old people are much more likely to vote in New Zealand than younger ones.
There was a negative correlation between turnout rate in 2020 and being in any age group under 40 years old. This shows that New Zealand is little different to other modern democracies when measured by the turnout rate of young people.
There was a strong positive correlation (0.63 or stronger) between turnout rate in 2020 and being in any age group above 50 years old. The over-50s hit the polling booths in massive proportions. If the General Disenfranchisement Rule shows us anything, it’s that Boomers are enfranchised.
The age group between 40 and 50 appears to be when, in New Zealand, the transition from liberal to conservative is made. This is also when the transition from renter/mortgage holder to homeowner is usually made. These two apparent facts are intimately related. Not until most people become homeowners themselves do they feel an interest in conserving the status quo.
Variable
Turnout rate in 2020
Percentage of males
-0.04
Contrary to the expectations of some – but which could be surmised by many – there is no statistical evidence that men are more enfranchised than women. Although the historical example has been one of male dominance, there is little evidence that this state of affairs exists in the present day. Indeed, the correlation between turnout rate in 2020 and being male was negative (if too weak to be significant).
This could be guessed by anyone who knew that the correlations between being male and holding any of the university degrees were all negative. However true the historical example of male dominance might be, the experience of today is closer to the opposite.
Variable
Turnout rate in 2020
Being European
0.83
Being Maori
-0.67
Being Pacific Islander
-0.63
Being Asian
-0.20
Anyone who thinks that white Kiwis and Maori Kiwis are roughly equally enfranchised would get a shock from looking at the statistics.
The correlation between turnout rate in 2020 and being of European descent was extremely strongly positive, at 0.83. This is one of the strongest correlations in this entire study, of either direction. The correlation between turnout rate in 2020 and being of Maori descent, by contrast, was strongly negative, at -0.67.
It might be true that Maoris are technically over-represented in Parliament, in that there are more Maori MPs than the Maori proportion of the population would warrant, but that isn’t the same thing as enfranchisement. Enfranchisement is when you can reasonably expect your MP to listen to you and to take your concerns seriously, whatever their race.
Pacific Islanders are about as disenfranchised as Maoris. The correlation between turnout rate in 2020 and being a Pacific Islander was -0.63. This cannot be explained by Pacific Islanders being outside the bicultural system, because the correlation between turnout rate in 2020 was much less negative, at -0.20. Thus, poor education and low levels of wealth better explain the low Pacific Islander turnout.
Some might argue that Asians vote in high numbers out of a sense of duty, and are not truly enfranchised. That may be true to some extent. Nonetheless, the fact is that if Asians do vote in high proportions, they will have a significant influence on the vote (see the cannabis referendum for an example).
Variable
Turnout rate 2020
Income < $5,000
-0.70
Income $5,000-$10,000
-0.43
Income $10,000-$20,000
-0.23
Income $20,000-$30,000
0.16
Income $30,000-$50,000
-0.19
Income $50,000-$70,000
0.28
Income > $70,000
0.45
The correlations between income groups and turnout rate in 2020 will surprise few. With a few exceptions, these correlations follow the General Disenfranchisement Rule closely, in that the rich tend to vote and the poor tend to not vote.
Voters in every income group below $20,000 had a significant negative correlation with turnout rate in 2020. This is not surprising, as most beneficiaries will be in this category, and beneficiaries comprise a large proportion of society’s most disenfranchised people.
Voters in both income groups above $50,000 had a significant positive correlation with turnout rate in 2020. The strongest was between having an income above $70,000 p.a. and turnout rate in 2020, which was 0.45. It is people in this group who politicians listen to the most.
The general rule is obvious: the wealthier a person is, the more enfranchised they tend to be. This rule is already widely understood, but it’s useful to put some numbers to it.
It might seem paradoxical that the correlation between turnout rate in 2020 and having an income between $20,000 and $30,000 is positive, while the correlation between turnout rate in 2020 and having an income between $30,000 and $50,000 was negative. This is because those receiving between $20,000 and $30,000 tend to be students and pensioners, and therefore not really disenfranchised, whereas those between $30,000 and $50,000 tend to be minimum wage workers or in other working-class occupations, and therefore closer to the bottom of society than either students or pensioners.
Variable
Turnout rate in 2020
Working as a manager
0.56
Working as a professional
0.30
Working as a technician or trades worker
0.01
Working as a community or personal services worker
-0.33
Working as a clerical or administrative worker
-0.14
Working as a sales worker
-0.35
Working as a machinery operator or driver
-0.61
Working as a labourer
-0.30
The two most privileged occupations are the two most enfranchised ones. Both of the correlations between turnout rate in 2020 and working as either a manager (0.56) or as a professional (0.30) were significantly positive. Ultimately it’s managers and professionals who run society, and so it’s them that politicians listen to the most.
People in middle-class jobs had moderate levels of enfranchisement. Neither of the correlations between turnout rate in 2020 and occupation were significant in the case of working as a clerical or administrative worker (-0.14) or working as a technican or trades worker (0.01). The latter correlation might even be more positive than expected, a result of the fact that technicians and trades workers tend to be in the relatively elderly age groups, and those age groups have high turnout rates.
Working-class Kiwis were the most disenfranchised. There was a significant negative correlation between turnout rate in 2020 and working as any of a machinery operator or driver (-0.61), sales worker (-0.35), community or personal services worker (-0.33) or labourer (-0.30). Politicians don’t generally care what people in these occupations think, hence the disenfranchisement.
Variable
Turnout rate in 2020
No source of income
-0.69
Income from wage or salary
-0.19
Income from self-employment or own business
0.68
Income from interest, dividends, rents or other investments
0.83
Income from ACC or private work insurance
-0.13
Income from NZ Super or Veteran’s pension
0.64
Income from Jobseeker Support
-0.74
Income from Sole Parent Support
-0.77
Income from Supported Living Payment
-0.39
Income from Student Allowance
-0.22
The cynical will feel proven correct when they hear that the correlation between turnout rate in 2020 and receiving an income from interest, dividends, rents or other investments was 0.83, one of the strongest correlations in this study. It is people who receive an income in this manner who are the most enfranchised of all.
Also highly enfranchised are people who receive an income from self-employment or one’s own business, and people who receive an income from NZ Super or Veteran’s pension. The correlation between turnout rate in 2020 and the former was 0.68, and with the latter it was 0.64.
These three groups of income recipients are the people that politicians listen to the most. A high proportion of them work as managers, whether hired or inheritors.
Perhaps dishearteningly, there was a negative (if not significant) correlation between turnout rate in 2020 and receiving an income from a wage or salary: -0.19. This suggests that the people who do most of the work in our society, whose efforts keep it running, are disenfranchised, nearly significantly so.
The most disenfranchised Kiwis are those on unemployment, sickness or invalid’s benefits. These are society’s forgotten, who have the lowest status and who politicians listen to the least. The correlation between turnout rate in 2020 and receiving income from Jobseeker Support was -0.74, and between turnout rate in 2020 and receiving income from Sole Parent Support was -0.77.
The correlation between turnout rate in 2020 and receiving income from a Student Allowance was negative, but not significantly so (-0.22). Again, this is because students occupy an usual place in the class hierarchy: disenfranchised by age, enfranchised by class. As such, their turnout rate was higher than the other non-pensioner beneficiaries.
Variable
Turnout rate in 2020
Has no religion
0.48
Is a Buddhist
-0.10
Is a Christian
-0.20
Is a follower of the Maori religions
-0.62
Is a Hindu
-0.29
Is a Jew
0.22
Is a Muslim
-0.32
Is a Spiritualist or New Ager
0.33
That New Zealand is a materialist society is shown by many things, and the correlations between turnout rate in 2020 and following a religion is another of those things. The religious affiliation that had the strongest positive correlation with turnout rate in 2020 was having no religion (0.48). This will surprise many who think of atheists as degenerate outsiders. In fact, the people running this society tend to have no religion.
There was a strong negative correlation between following one of the Maori religions and turnout rate in 2020 (-0.62). This is no doubt a function of the significant negative correlation between being Maori and turnout rate in 2020.
Weaker, although still negative, correlations were found between turnout rate in 2020 and being a Muslim (-0.32), a Hindu (-0.29), a Christian (-0.20) or a Buddhist (-0.10). The correlation with Christianity will surprise many, as it is generally assumed that Christians comprise a large part of the power structure in New Zealand. Although this is true, a high proportion of practicising Christians in New Zealand are relatively disenfranchised Pacific Islanders.
Variable
Turnout rate in 2020
No children
-0.03
One child
-0.38
Two children
0.56
Three children
0.34
Four children
-0.21
Five children
-0.58
Six or more children
-0.74
Another nonlinear set of correlations are those between turnout rate in 2020 and number of children.
Some might expect that, since people with no religion have a high turnout rate, and since people with no religion often have no children, that people with no children must have a high turnout rate. This is not the case. The correlation between turnout rate in 2020 and having no children was -0.03.
The strongest positive correlation between turnout rate in 2020 and having any number of children was with two children (0.54), followed by three children (0.34). These correlations represent modal families, in the sense that most upper-middle-class families will have two or three children.
There was a negative correlation between turnout rate in 2020 and any of having four children (-0.21), five children (-0.58) or six or more children (-0.74). This reveals that two is the normal number of children to have, and that a person becomes more disenfranchised the more children they have beyond two.
Variable
Turnout rate in 2020
Own or part own house
0.68
Own house in family trust
0.62
Neither outright ownership of house nor house in family trust
-0.79
One of the main reasons why housing is a major issue in most Western countries right now is that it relates to the feeling of being part of society. For many people, if they don’t own a house they don’t feel like they have a stake in society, and those who don’t feel like they have a stake in society tend to not bother voting.
Reflecting this is the extremely strong negative correlation between turnout rate in 2020 and neither owning a house nor owning a house in a family trust. This was -0.79, showing that non-houseowners are one of New Zealand society’s most disenfranchised groups, despite also being a very large one.
The correlation between turnout rate in 2020 and owning or part-owning a house, by contrast, was 0.68. This is very strong, and shows that homeowners definitely consider themselves listened-to by the political establishment.
In summary, the turnout rates among the various demographics in the 2020 General Election reflect the extent to which those various demographics are enfranchised by the political establishment. ACT/National-voting, old, educated, atheist, white, homeowning managers and professionals of either gender are those primarily enfranchised by the current order, and Maori Party/ALCP-voting, young, poorly-educated, Maori and Pacific Islander, renter labourers and beneficiaries are those primarily disenfranchised.
*
This article is an excerpt from the upcoming 3rd Edition of Understanding New Zealand, by Dan McGlashan and published by VJM Publishing. Understanding New Zealand is the comprehensive guide to the demographics and voting patterns of the New Zealand people.
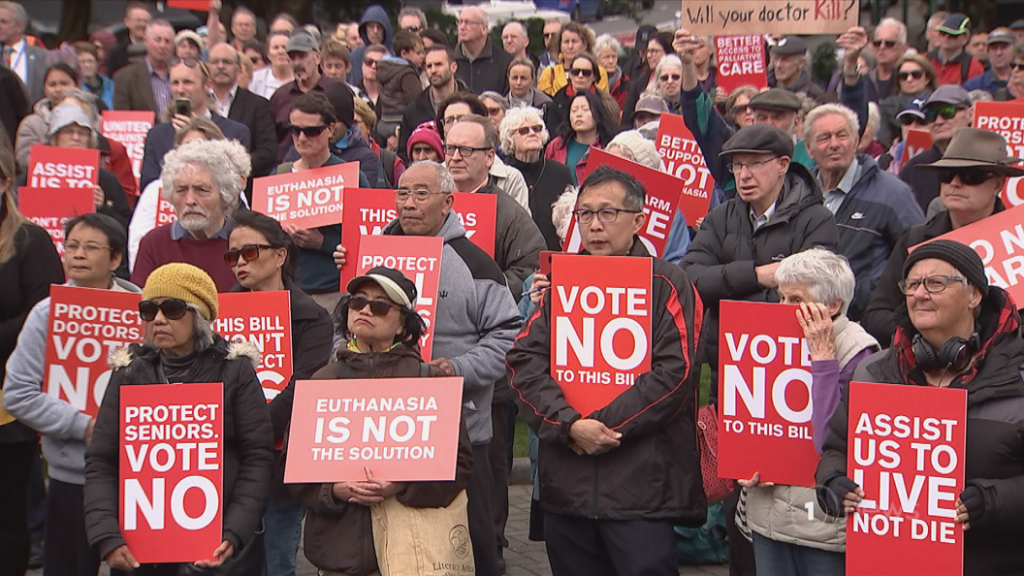
The euthanasia referendum took place at the same time as the cannabis referendum. It attracted much less attention than the cannabis one, probably because a vote in favour of reform appeared to be inevitable from the beginning. In the end, 1,893,290 people voted in favour of euthanasia, with only 979,079 against, meaning that 65.1% were in favour of reform.
Although the euthanasia issue is usually presented as one of religious morality, it’s much more complicated than that.
As with the cannabis referendum, the normal ballots for both General Electorates and Maori Electorates were placed in the same box, making it impossible to draw meaningful statistical inferences about voting patterns. This chapter, therefore, focuses on special votes only.
Variable
Special voting Yes for euthanasia
No religion
0.27
Buddhism
0.36
Christianity
-0.39
Hinduism
0.16
Islam
0.09
Judaism
0.62
Maori religions
-0.31
Spiritualism and New Age
0.14
It’s true that, as with cannabis law reform, the main opponents to euthanasia were Christians. Perhaps surprising to most, however, sentiments were not particularly strong about the topic in either direction. Although the correlation between being Christian and special voting Yes in the euthanasia referendum was significantly negative, at -0.39, this was weaker than the correlation between being Christian and special voting Yes in the cannabis referendum (-0.48).
Spiritualists and New Agers, Buddhists, Hindus, Jews and the non-religious were the most likely to special vote Yes in the euthanasia referendum. These groups don’t tend to have superstitious beliefs about keeping people alive even when terminally suffering, which is primarily a Christian belief, itself a consequence of the Christian non-belief in reincarnation.
Also surprising is that the correlation between special voting Yes in the euthanasia referendum and having no religion was only 0.27. This was significant, but only barely so.
The fact that it was significant reveals the extent to which materialists in general support legal access to euthanasia. The fact that it was only barely so reveals the extent to which superstitions around death are universal in nature and not restricted to the followers of any particular religious tradition.
Variable
Special voting Yes for euthanasia
No qualifications
-0.73
Level 1 certificate
-0.59
Level 2 certificate
-0.57
Level 3 certificate
0.07
Level 4 certificate
-0.60
Level 5 diploma
-0.54
Level 6 diploma
0.23
Bachelor’s degree
0.69
Honours degree
0.75
Master’s degree
0.75
Doctorate
0.61
Underlining the degree to which fear of euthanasia is mostly an irrational one, but not necessarily religious in origin, are the correlations between educational attainment and special voting Yes in the euthanasia referendum.
The correlation of -0.73 between having no NZQA qualifications and special voting Yes in the euthanasia referendum was much stronger than any correlation between religious belief and special voting Yes, whether negative or positive. This correlation cannot entirely be explained by appealing to the fact that older people, who tend to be more conservative on such issues, tend to also be less well educated (see below).
Likewise, the correlations between having a Master’s degree or an honours degree and special voting Yes in the euthanasia referendum were both 0.75. This is probably because educated people have thought about the issue more, and are more likely to conclude that death is nothing to fear, and that forcing the terminally ill to stay alive is immoral.
Historically, the strongest pro-euthanasia support has come from those educated into a scientific materialist framework. This is probably because such people have the least superstitious worry about going to Hell if they end their own lives.
Variable
Special voting Yes for euthanasia
Working in agriculture, forestry or fishing
-0.37
Working in mining
-0.17
Working in manufacturing
-0.66
Working in electricity, gas, water or wastewater
-0.24
Working in construction
-0.21
Working in wholesale trade
0.00
Working in retail trade
-0.25
Working in accommodation or food services
0.31
Working in transport, postal or warehousing
-0.42
Working in information media or telecommunications
0.62
Working in financial or insurance services
0.56
Working in rental, hiring or real estate services
0.49
Working in professional, scientific or technical services
0.74
Working in administrative or support services
-0.01
Working in public administration or safety
0.20
Working in education or training
0.09
Working in healthcare or social assistance
-0.18
Working in arts and recreation services
0.54
There are strong correlations between the average education level of an occupation and that occupation’s willingness to special vote Yes in the euthanasia referendum.
The strongest positive correlations between working in a particular occupation and special voting Yes in the euthanasia referendum were for the typically highly-educated professions such as professional, scientific or technical services (0.74), information media and telecommunications (0.62) or financial and insurance services (0.56).
The typically poorly-educated professions were much less likely to support euthanasia. The correlation between voting Yes in the euthanasia referendum and working in manufacturing was -0.66; with working in transport, postal or warehousing it was -0.42; with working in agriculture, forestry or fishing it was -0.37.
It might seem strange that education level was a much stronger predictor of opposition to euthanasia than religion. After all, the ban on euthanasia was initially motivated by religious sentiments. It appears that superstition is highly prevalent among the poorly-educated in New Zealand, even more so than among the religious.
Variable
Special voting Yes for euthanasia
Working as manager
0.28
Working as professional
0.70
Working as a technician or trades worker
-0.44
Working as community or personal services worker
-0.24
Working as clerical or administrative worker
0.11
Working as sales worker
-0.00
Working as machinery operator or driver
-0.62
Working as labourer
-0.64
As with industries, professions were much more likely to support euthanasia if they were educated.
The best-educated profession is working as a professional, and the correlation between special voting Yes for euthanasia and working as a professional was a very strong 0.70. Working as a manager was also significantly correlated with special voting Yes for euthanasia, although the correlation was much weaker, at 0.28.
The least-educated professions had the strongest negative correlations with special voting Yes for euthanasia. These were working as a machinery operator or driver (-0.62) and being a labourer (-0.64). To some extent these correlations can also be explained by the fact that many machinery operators, drivers and labourers are Maori or Pacific Islander, who tended to oppose euthanasia.
Variable
Special voting Yes for euthanasia
Age 20-24
0.43
Age 25-29
0.50
Age 30-34
0.44
Age 35-39
0.31
Age 40-44
0.23
Age 45-49
0.21
Age 50-54
0.07
Age 55-59
-0.10
Age 60-64
-0.15
Age 65-69
-0.13
Age 70-74
-0.12
Age 75-79
-0.15
Age 80-84
-0.18
Age 85+
-0.08
Young people are, of course, more removed from death than older people. This could perhaps lead to them being more blase about the subject, explaining their support for euthanasia. Old people are significantly more Christian than young people, but did not vote against euthanasia in significant numbers. The truth is that euthanasia has reasonably broad support across all age groups.
All of the age groups from 45-49 years old and above had no significant correlation with special voting Yes in the euthanasia referendum. This result will surprise the many who would have expected significant negative correlations. Old Christians seem to be much less against euthanasia than they were against cannabis – perhaps because euthanasia prohibition threatens to cause suffering to them, whereas cannabis prohibition mostly causes suffering to others.
Variable
Special voting Yes for euthanasia
No children
0.66
One child
0.00
Two children
-0.12
Three children
-0.49
Four children
-0.67
Five children
-0.65
Six or more children
-0.55
One of the strongest correlations was between special voting Yes in the euthanasia referendum and having no children – this was 0.66. This can mostly be explained by the existence of a strong correlation between special voting Yes in the euthanasia referendum and having no NZQA qualifications.
There was a correlation of -0.67 between having four children and special voting Yes in the euthanasia referendum. This might best be explained by reference to the fact that those with four children tend to be less well educated than the average, and the less well educated tend to oppose euthanasia.
An alternative explanation is that those with the strongest pro-life sentiments will both have many children and oppose euthanasia. These sentiments, contrary to popular belief, are far from necessarily Christian. Some will be, but most not.
Variable
Special voting Yes for euthanasia
Yearly income < $5,000
0.03
Yearly income $5,000-$10,000
0.14
Yearly income $10,000-$20,000
-0.54
Yearly income $20,000-$30,000
-0.53
Yearly income $30,000-$50,000
-0.60
Yearly income $50,000-$70,000
0.12
Yearly income $70,000+
0.69
This set of correlations is unusual. They start relatively neutral, then become significantly negative as people become wealthier, and then become significantly positive as people become still wealthier. This is different to the usual linear pattern seen in correlations between e.g. education and income.
Probably this pattern can best be explained by appeal to the fact that the wealthiest segment of the population is also the most highly-educated, whereas the middle-wealthiest segment is the poorest educated, and the poorest segment of the population, because it is mostly comprised of students, pensioners and young workers, is a blend of both.
Therefore, the wealthiest and most highly-educated Kiwis special voted Yes for euthanasia, the middle-wealthy and most poorly-educated Kiwis voted against it, and the poorest and middle-educated Kiwis were inbetween the two.
Variable
Special voting Yes for euthanasia
Born in New Zealand
-0.40
A very curious result is that those born in NZ were significantly less likely to vote for euthanasia. Being NZ-born made a person even more likely to vote against euthanasia than being a Christian did.
This is primarily a function of the fact that NZ-born voters are significantly less educated than foreign-born ones, and poorly-educated people voted heavily against euthanasia. The sort of person who immigrates to a foreign country tends to be the sort of person who is not superstitious.
Variable
Special voting Yes for euthanasia
NZ European
0.13
Maori
-0.32
Pacific Islander
-0.22
Asian
0.28
There were no strong correlations between belonging to a particular race and voting a particular way in the euthanasia referendum. There was a significant negative correlation between being Maori and special voting Yes in the euthanasia referendum, and there was a significant positive correlation between being Asian and special voting Yes. However, neither was particularly strong.
Perhaps the most curious outcome here is the fact that Asians were the race most likely to vote in favour of euthanasia law reform, at the same time as being the race least likely to vote in favour of cannabis law reform. This is especially noteworthy given the strength of the correlation between special voting Yes for euthanasia and special voting Yes for cannabis (see below).
Also noteworthy is the fact that Maoris and Pacific Islanders voted similarly on euthanasia, when their votes were very different on cannabis. Just because pan-Pacific opposition to some reforms (like euthanasia) might exist, doesn’t mean that it exists with regard to other reforms (like cannabis).
Variable
Special voting Yes for euthanasia
Special vote Yes for cannabis
0.74
One of the strongest correlations of all was between special voting Yes in the euthanasia referendum and special voting Yes in the cannabis referendum. This is because Yes voters in both instances tended to be young and well-educated. Most people in this category felt that both euthanasia prohibition and cannabis prohibition were antiquated laws that reflected the morality of a bygone age.
The major difference between the two is that those special voting Yes in the euthanasia referendum tended to be foreign-born, whereas those special voting Yes in the cannabis referendum were more likely to be New Zealand-born.
Variable
Special vote Yes for euthanasia
Voting Labour 2020
-0.09
Voting National 2020
0.17
Voting Greens 2020
0.70
Voting ACT 2020
0.17
Voting New Zealand First 2020
-0.28
Voting Maori Party 2020
-0.21
Voting New Conservative 2020
-0.21
Voting The Opportunities Party 2020
0.60
Voting Advance NZ 2020
-0.31
Voting Sustainable NZ 2020
0.47
Voting ALCP 2020
-0.31
Voting TEA Party 2020
0.13
Voting Heartland NZ 2020
-0.02
Voting Social Credit 2020
-0.21
Voting NZ Outdoors Party 2020
-0.16
Voting ONE Party 2020
-0.30
Voting Vision NZ Party 2020
-0.23
The party correlations provide more evidence for the trends already outlined.
The parties with well-educated voters tended to support euthanasia. The correlation between special voting Yes in the euthanasia referendum and voting Greens was 0.70; with voting The Opportunities Party it was 0.60; with voting Sustainable NZ it was 0.47. All of these parties make a point of basing their opinions on evidence, and therefore they reject the “if you kill yourself you go to Hell” narrative.
Advance NZ and ALCP had two of the most poorly-educated voting blocs, and those blocs were also the least likely to support euthanasia. The correlation between special voting Yes for euthanasia and voting for either party in 2020 was significantly negative, at -0.31. There was also negative correlations between special voting Yes for euthanasia and voting ONE Party, Vision NZ, Maori Party or New Conservatives.
Considering that ACT voters tend to be highly educated, and that many of them are Chinese (who tend to support euthanasia), it might seem surprising that the correlation between voting ACT in 2020 and special voting Yes for euthanasia was only 0.17. This can be explained by the fact that ACT voters in 2020 were much older than they usually are, and old people tended to oppose euthanasia.
Variable
Special vote Yes for euthanasia
Median income
0.55
Mean income
0.65
There were strong correlations between personal wealth and support for euthanasia. The correlation between special voting Yes for euthanasia and median income was 0.55, and with mean income it was 0.65. These two correlations lay bare the extent to which the people near the top of society supported euthanasia reform.
It’s not likely that wealth, by itself, makes a person more likely to support euthanasia. More likely it’s education that does so, and since wealth is highly correlated with education it’s also correlated with support for euthanasia.
In summary, those who cast a special vote for Yes in the euthanasia referendum were primarily well-educated. They varied greatly in race, income, religion and age, but the strongest correlations with special voting Yes for euthanasia were with educational levels.
Euthanasia, unlike cannabis, was an issue on which the ruling class were mostly agreed. This is, at least partly, because the ruling class is almost entirely materialist. This materialism apparently makes it easier to see the benefit in “death with dignity” measures such as euthanasia, but does not make it easier to see the benefit in legalising spiritual sacraments such as cannabis.
*
This article is an excerpt from the upcoming 3rd Edition of Understanding New Zealand, by Dan McGlashan and published by VJM Publishing. Understanding New Zealand is the comprehensive guide to the demographics and voting patterns of the New Zealand people.