
Understanding New Zealand: Demographics of Turnout Rate

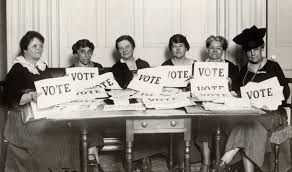
Examining the demographics of the turnout rate in 2014 gives us an opportunity to look closely at the general disenfranchisement rule. If it holds true, as we have suggested so far, that the turnout rate of any given demographic will be proportionate to the degree that this demographic can expect to have its wishes met by the political establishment, then this section ought to tell us a lot about the sort of person who runs New Zealand.

Commensurate with the fact that all Kiwi Prime Ministers up until now have been Pakeha, there is a very strong correlation of 0.71 with being of European descent and turnout rate in 2014. This was not only the strongest but the only correlation of its kind that was positive.

The correlation with turnout rate in 2014 was -0.10 for being Asian, -0.44 for being a Pacific Islander and -0.77 for being Maori. The correlation between turnout rate in 2014 and being Maori is so strongly negative that barely half of all eligible Maoris voted in 2014.

Pacific Islanders are disenfranchised by poverty and poor education to a similar degree to Maoris, but as a consequence of being relatively recent immigrants they do not have the intergenerational trauma that Maoris do.

Predictably, then, the correlations between turnout rate and religion reflects the religious proclivities of the various ethnicities.

The religious beliefs that had the strongest positive correlations with turnout rate in 2014 were Anglicanism (0.41), Presbytarianism (0.32), Brethren (0.32) and Judaism (0.30).

The religious beliefs that had the strongest negative correlations with turnout rate in 2014 were Mormonism (-0.68), Ratana (-0.68), Maori Christian (-0.64) and Jehovah’s Witness (-0.57).

Interestingly, there was a significant positive correlation of 0.24 between having no religion and turnout rate in 2014. This contradicts the glibly accepted wisdom that the religious like to vote and the irreligious do not – in reality there are more fundamental factors in play.

What supports the accepted wisdom is the very strong positive correlation of 0.77 between turnout rate in 2014 and median age. Old people love to vote: indeed, for many of them it is the very highlight of their year. It should, however, be noted that the strength of this correlation is mostly an artifact of needing to be eighteen years old in order to cast a vote.

In fact, for people in the 20 to 29 age bracket, the correlation with turnout rate in 2014 was -0.21, which was negative but not significant.

One trend is very clear: that the more educated a person is the more likely they are to be engaged with the political system. This directly follows the general enfranchisement rule, considering that a Kiwi with a degree is vastly more likely to work in the higher levels of government, and one with an advanced degree even more so.

The correlation between turnout rate in 2014 and having no qualifications was -0.46. This is not particularly strong, but if one considers that most people with no qualifications are old and that old people love to vote, one can guess that very few young people with no qualifications vote at all.

On the other hand, the correlations between turnout rate in 2014 and having a degree were significantly positive for all degrees. Between turnout rate in 2014 and having a doctorate the correlation was 0.45. As for no qualifications, this correlation is partially an artifact of the relatively recent expansion of the tertiary education system, one consequence of which is the relative youth of higher degree holders.

The correlation between turnout rate in 2014 and being on the pension ws 0.51, which, as mentioned above, reflects that many pensioners still command a considerable amount of wealth and are very engaged in the direction of the political system, despite no longer working.

One result that some might find surprising is that the correlation between turnout rate in 2014 and being on the invalid’s benefit (-0.53) is not as strong as the correlation between turnout rate in 2014 and being on the unemployment benefit (-0.76). This could be surprising because it could reasonably be expected that an invalid is more severely disenfranchised than someone who could conceivably have a full-time job next week.

The difference is that the class of unemployed in New Zealand are disproportionately drawn from the generally disenfranchised – the poor, the young, the Maori etc. The class of invalids, by contrast, are generally more average people who have fallen ill due to injury, an unfortunate genetic condition or mental illness. This means that they are drawn more evenly from all social classes and ethnic groups.

The correlation between being on the pension and turnout rate in 2014 is so strong, and these pensioners so numerous, that there are negative correlations between turnout rate in 2014 and working in most industries. The strongest were in transport, postal and warehousing (-0.64), manufacturing (-0.51) and administrative and support services (-0.44).

The only significant positive correlation between turnout rate in 2014 and working in any industry was with the exceptionally not disenfranchised professional, scientific and technical services, which was 0.28.

Men vote significantly more than women, which follows the general disenfranchisement rule. The correlation between turnout rate in 2014 and being male was 0.29, which perhaps reflects a weakly-held folk belief that politics is a man’s business and a man’s world.

Curiously, being born in New Zealand had a significant negative correlation of -0.24 with turnout rate in 2014. That the foreign-born vote more than Kiwis might surprise many. However, if one considers that being born in Britain has a correlation of 0.81 with turnout rate in 2014, and that almost all Maoris in New Zealand are New Zealand-born, the reasons why become apparent.

Predictably, the poor do not vote as often as the wealthy. All of the income bands from $0-50K had significant negative correlations without turnout rate in 2014, except for the student bands of $15-25K. All of the income bands above $70K had significant positive correlations with turnout rate in 2014.

The above statistic might be the single most important correlation detailed in this study.

If the most basic division of New Zealand society is into haves and have-nots, the next most basic might be into the have-a-lots, the have-a-littles, and the have-bugger-alls. This neatly reflects the three basic kinds of land tenure: freehold, mortgage, and renting.

As a consequence, the correlations between turnout rate in 2014 and tenure of dwelling are 0.72 for freehold land, -0.66 for rented land and an even -0.00 for mortgaged land.

One final curiousity is the correlation of 0.21 between turnout rate in 2014 and living in the South Island. This is much stronger than most people might expect, and possibly reflects the degree to which old money from the early settlement of the South Island still enfranchises the inheritors of it.

*

This article is an excerpt from Understanding New Zealand, by Dan McGlashan, published by VJM Publishing in the winter of 2017.

Understanding New Zealand: Demographics of Labour Force Status

Here’s one correlation that won’t surprise anyone: the correlation between working full time and net personal income is a very strong 0.80. It is to no-one’s surprise that the people who do the bulk of the work earn the bulk of the income.

The correlation between being unemployed and net personal income is -0.54. That is not as strong as some might have thought, perhaps because the unemployment benefit draws a line under how poor it is possible to be under normal circumstances.

Contrary to what is arguably the biggest stereotype in New Zealand, the difference between Kiwis of European descent and Maoris in likelihood to work a full-time job is not that large. The correlation between working full-time and being of European descent was a significantly positive 0.29, but the correlation between working full-time and being Maori was not significant, at -0.22.

In fact, Maoris were more likely to be in full-time employment than the average Kiwi of Pacific Island descent. The correlation between being a Pacific Islander and being in full-time work was significantly negative at -0.29.

The big difference was in the rate of part-time employment among Kiwis of European descent. The correlation between working part-time and being of European descent was a very strong 0.83. This can mostly be explained with reference to the moderately strong correlation between working part-time and median age, which was 0.50.

In particular, there is a big cultural difference between Kiwis of European descent and Maoris when it comes to post-working life options. When a Paheka winds down from the peak of their career, they tend to take on part-time work; when a Maori winds down from the peak of their career, they tend to take on childcare duties for grandchildren or other family.

Pacific Islanders who immigrate to New Zealand generally do so to work, and the next generation that grows up in New Zealand does so with the unemployment rates that could be expected from the general level of disenfranchisement of that demographic. This explains why they there is an extremely strong negative correlation of -0.82 between being a Pacific Islander and working part-time.

Curiously, being of no religion had a stronger positive correlation with working full-time (0.40) than any of the 20 religious orientations in this study. The only religious traditions with the strongest positive correlations with working full-time were Judaism (0.28), Catholicism (0.22), Buddhism (0.13), Presbytarianism (0.09) and being a Baptist (0.01). All others were negative.

Another curiosity is that the correlation between working full-time and median age was 0.01, suggesting that working full-time is the default condition of a New Zealander.

The age bracket with the strongest positive correlation with working full-time was the 30 to 49 age bracket – this was 0.71. Interestingly, the correlation with working full-time was higher for the 20 to 29 age bracket (0.12) than for the 50 to 64 age bracket (0.00) – which puts paid to the myth of lazy youth.

The correlations with working part-time are strongest for the two oldest age brackets. With the 50 to 64 age bracket it was 0.59, and with the 65+ age bracket it was 0.49.

Another striking trend was that the better educated a person is, the more likely they are to work full-time.

Having no qualifications was the only educational level to have a significant negative correlation with working full-time – this was -0.37. For all of the people whose highest qualification was achieved at secondary school, there was no significant trend either way.

All groups of people with tertiary educations had significantly positive correlations with working full-time, the strongest being between working full-time and having an Honours degree (0.47).

Some industries were clearly more likely to employ full-time workers than others. The strongest significantly positive correlations with working full-time were with arts and recreation services (0.53), professional, scientific and technical services (0.52), financial and insurance services (0.48) and information media and telecommunications (0.44).

This probably reflects the fact that people working in these industries are high-value workers and these industries are paid well, and so there is an economic incentive for them to work as many hours as possible.

The strongest significantly positive correlations with working part-time were with agriculture, forestry and fishing (0.46), retail trade (0.38), construction (0.36) and rental, real estate and hiring services (0.35), usually for opposite reasons to those given in the above paragraph.

All of the current rhetoric about the pay gap can be dismissed with reference to one statistic: the correlation of 0.48 between working full-time and being male. There is also a significant positive correlation between working part-time and being male. Together this tells us that the majority of the paid labour performed in New Zealand is performed by men.

There is a correlation of 0.74 with being a regular tobacco smoker and being unemployed. This is very strong and hints at a number of things: being unemployed is boring, the same class of people that doesn’t work also smokes and many people who are unemployed are rendered so by psychological conditions that tobacco smoking might alleviate.

There is a significant positive correlation between being born in New Zealand and both working part-time (0.46) and being unemployed (0.26). This indicates the degree to which our immigration system prioritises letting in people who look like they have high long-term productive potential.

A significant positive correlation exists between both working full-time and taking a bus to work (0.39) and working part-time and biking to work (0.40). This reflects the fact that many more job oportunities are available in the big cities that also have bus networks, as opposed to the smaller centres in which it is more pleasant to cycle.

*

This article is an excerpt from Understanding New Zealand, by Dan McGlashan, published by VJM Publishing in the winter of 2017.
Understanding New Zealand: Demographics of High-Skill Occupations

This article is a companion to the earlier Voting Patterns of High-Skill Occupations.

Because the sort of person who becomes a manager is the same sort of person who runs everything else in the country, including – and especially – the Government, the demographics of this occupation will tell us a lot about the sort of person who controls the power apparatus in New Zealand.

Predictably, there is a very strong positive correlation between being of European descent and working as a manager – this was 0.54. Also predictably, there was a very strong negative correlation between being a Pacific Islander and working as a manager – this was -0.60.

Some might be surprised to find out that the correlation between being Maori and working as a manager was very close to zero – namely, -0.11. In other words, it was much less strongly negative than the comparable correlation with being of Pacific Island descent.

This reflects a number of things, the foremost being that Maoris are more likely to have the necessary mana to be appointed a manager in the first place.

The ethnic demographics of professionals, by contrast, reflected educational demographics. The correlation between being Asian and working as a professional was 0.37, which reflects the fact that a professional degree is a ticket to move almost anywhere in the world you like, and that many Asians use that ticket to move to New Zealand.

Anyone who has been exposed to a Luciferian conspiracy theory recently might be interested to learn that working in a high-skill occupation is fairly strongly correlated with having no religion. The correlation between working as a manager and having no religion was 0.49, which is extremely strong if one considers that managers tend to be much older than average and that old people are much more religious than average.

The correlation between working as a professional and having no religion was 0.33, also fairly strong if one takes into account that many of the New Zealand professional class are born in highly religious overseas countries or communities (there are positive correlations between working as a professional and being any of Catholic, Jewish, Muslim or Hindu).

The major division in the high-skill group is one of age: managers are much older than professionals, for the obvious reason that the skills needed to become a manager are learned over the course of a career, while the skills needed to become a professional are usually learned before the career begins.

The correlation between median age and working as a manager was 0.43. There was a positive correlation between working as a manager and all age brackets above 30 years of age, which is understandable given that it takes time to learn how to manage a business.

The correlation between median age and working as a professional was -0.15. This was not significant but still shows that the professional class in New Zealand is very young. Mostly this was because the age brackets between 20 and 50 years of age all had correlations stronger than 0.50 with working as a professional.

This is primarily for two reasons. The first is that a recently graduated foreign professional is more strongly advantaged by the immigration system than an older one, and the second is that the tertiary education sector in New Zealand has only recently expanded and so the bulk of Kiwi professionals are only recently trained.

Professionals on average are wealthier than managers, despite being younger. The correlation between net personal income and working as a professional was 0.68, compared to 0.49 for managers.

The disparity is most evident when one looks at specific income bands. For people in the $60-70K income band, the correlations with being a manager and being a professional were about the same: for the former it was 0.54 and for the latter it was 0.56.

It was even stronger for people in the $70-100K income band: the correlation between being in this band and being a manager was 0.49 and for being a professional 0.84. It was strongest of all in the $100-150K income band: the correlation between being in this band and being a manager was 0.41 and for being a professional an extremely strong 0.88.

This tells us that there are proportionately few managers in the very highest income brackets, for the simple reason that this is where the vast bulk of doctors, lawyers, judges, psychologists etc. are.

In other words, becoming a manager is the slow route to the big time, whereas getting a professional degree is the fast route. Nowhere is this more evident than when the correlations with the higher degrees are examined.

The correlations between working as a manager and having an Honours, Master’s or doctorate degree were 0.17, 0.11 and 0.08 respectively. None of these were significant. The corresponding correlations for professionals were extremely strong: 0.93, 0.91 and 0.76.

Perhaps these differences can be explained by a natural intelligence gap. All other things being equal, a person in a high-skill occupation is going to be more intelligent than someone in a non-high-skill occupation. However, the manager class is mostly built up over time from the most suitable of people from the medium-skill occupations, whereas the professional class mostly consists of people who have been identified as specially academically talented since their first years of school.

There may be support for this supposition with a look at the patterns of tobacco smoking. The managerial class had a correlation of 0.44 with being an ex-smoker and a correlation of -0.01 with having never smoked. This suggests that they are the sort of person who is much like anyone else until they get older and find that the health drawbacks of smoking outweigh the psychological benefits.

The professional class, by contrast, had a correlation of 0.59 with never having smoked. As both ex-smokers and people who have never smoked (plus a large number of current smokers) could all tell you, never having smoked tobacco is the smartest option, if you can manage it!

Another notable difference between the two classes is that professionals have a significant positive correlation with being born overseas (0.37), whereas managers are slightly less likely than the average Kiwi to be so (-0.17).

This reflects the fact that it takes so long to work one’s way up to become a manager that it’s far easier to do if you stay in the same country. Professionals have much less in the way of such considerations.

*

This article is an excerpt from Understanding New Zealand, by Dan McGlashan, published by VJM Publishing in the winter of 2017.

Understanding New Zealand: Voting Patterns of Beneficiaries

If the general disenfranchisement rule has applied so far in this study, it could be confidently predicted that the turnout rate of beneficiaries would be considerably lower than average. As it turns out, this is only part of the truth. It turns out that some beneficiaries are much less disenfranchised than others.

Pensioners, for example, are generally very happy to turn out and cast a vote for National. The correlation between receiving a pension and turnout rate in 2014 was 0.51, and between receiving a person and voting National in 2014 it was 0.50. Pensioners were even more likely to vote Conservative in 2014 – the correlation there was a very strong 0.64.

Both of these correlations were much stronger than the correlation between claiming a pension and voting New Zealand First, which was 0.33. Many will find this surprising as New Zealand First is often pigeonholed as the pensioners’ party.

The voting patterns of pensioners reflect genuine old-school conservatism, which is why National, Conservatives and the former National MP Winston Peters do so well among them. This is also reflected in the significant negative correlations between both being a pensioner and voting Green in 2014 (-0.24) and between being a pensioner and voting ACT in 2014 (-0.30).

Perhaps oddly, the Aotearoa Legalise Cannabis Party does better among pensioners than any of the Maori-heavy parties or Labour. The correlation between claiming a pension and voting ALCP was -0.19, which, although negative, is not significant. The reason for this probably is because once a person is of pensionable age they are more likely to suffer the kind of health ailments that could be ameliorated by cannabis, and and therefore more likely to have become aware of its medicinal properties and the benefits of law reform.

The strongest negative correlation with being a pensioner was with voting Labour in 2014, which was -0.53. With voting Maori Party in 2014 it was -0.34 and with voting Internet MANA it was -0.36.

The second least disenfranchised group of beneficiaries were students. Although students are typically stereotyped as disinterested in voting, the correlation between claiming a student allowance and turnout rate in 2014 was only -0.33. Although this is significant, it is much weaker than the correlations for the unemployment and invalid’s benefits.

Above anyone else, Kiwi students love to vote Green. The correlation between claiming a student allowance and voting Green in 2014 was 0.55. This probably reflects the degree of leftist sentiment among middle-class students. The next highest was the correlation between claiming a student allowance and voting Labour in 2014, which was 0.34.

To a major extent, the patterns for the rest of the parties mirrored the fact that students are virtually always on the opposite end of the age spectrum to pensioners.

Thus, there were moderately strong correlations between being a student and voting for any of the Maori-heavy parties, except for New Zealand First. Betwen being a student and voting Maori Party in 2014 the correlation was 0.26, with voting Internet MANA it was 0.29 and with voting ALCP it was 0.17.

New Zealand First was disfavoured by students, but not significantly so – the correlation between claiming a student allowance and voting New Zealand First in 2014 was -0.18.

The two most disfavoured parties by students were, of course, National and the Conservatives. The correlation between claiming a student allowance and voting for the former in 2014 was -0.46 and with voting for the latter it was -0.51.

If students and pensioners can be generally considered middle-class beneficiaries, then invalids and the unemployed can be considered the lower-class ones.

The correlation between turnout rate in 2014 and being an invalid’s beneficiary was -0.53, and between turnout rate in 2014 and being an unemployment beneficiary it was a very strong -0.76. Considering that people in both of these groups have the time to vote, these figures speak of an immense disenfranchisement.

Predictably, then, when they did vote it was not for right-wing parties. If a Kiwi is on the invalid’s benefit, the correlation with them voting National in 2014 was -0.65, and if they were on the unemployment benefit it was a whopping -0.85.

Being on the invalid’s benefit had a correlation of -0.35 with voting for the Conservative Party in 2014 and one of -0.59 with voting for ACT in 2014. Being on the unemployment benefit was almost the precise opposite: a correlation of -0.60 with voting for the Conservative Party in 2014 and one of -0.38 with voting for ACT in 2014.

The party that lower-class beneficiaries like to vote for more than any other is the Aotearoa Legalise Cannabis Party. The correlation between voting ALCP in 2014 and being an unemployment beneficiary is a very strong 0.79, and with being an invalid’s beneficiary it is almost as strong, at 0.76.

The reason for this is that New Zealand’s cannabis laws are little more than a kick in the guts to the already poor, sick and disenfranchised.

The two next favoured parties for lower-class beneficiaries were New Zealand First and Labour. The correlation between being an invalid’s beneficiary and voting New Zealand First in 2014 was 0.69, and with voting Labour it was 0.44. They were slightly stronger for unemployment beneficiaries: between being an unemployment beneficiary and voting New Zealand First the correlation was 0.57, and with voting Labour it was 0.62.

Unemployment beneficiaries and invalid’s beneficiaries were both indifferent to the Greens, further underlying the specific appeal of that party to the middle class. The correlations between being on either benefit and voting Green in 2014 were almost perfectly uncorrelated.

The correlations between being on the unemployment benefit and voting Maori Party in 2014 (0.79) and with voting Internet MANA in 2014 (0.76) were about as strong as for voting for the ALCP. The correlations between being on the invalid’s benefit and voting for these parties was slightly weaker: for the Maori Party it was 0.59 and for Internet MANA it was 0.56.

This reflects the large numbers of Maoris on these two benefits, as well as the fact that invalid’s beneficiaries, who want cannabis for medicine, have a greater interest in cannabis law reform than the unemployed, who often want it as a recreational alternative to alcohol.

*

This article is an excerpt from Understanding New Zealand, by Dan McGlashan, published by VJM Publishing in the winter of 2017.