Black Caps vs. Bangladesh, Champions Trophy Pool Match Preview

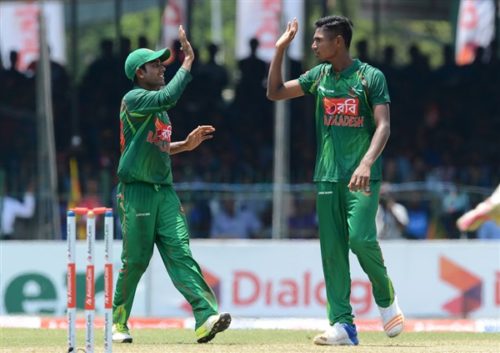
Mustafizur Rahman, with a strike rate of 22.7 in ODIs, would fancy himself against the Black Caps middle order if he gets a chance against them in tonight’s do-or-die encounter in Cardiff

This Champions Trophy has been one of upsets. The Black Caps got themselves into a position of control before the rain set in against the slightly favoured world champion Australia side, then Pakistan defeated the moderately favoured South Africa side, and last night Sri Lanka defeated the massively favoured India side.

An even worse omen for the Black Caps is the fact that they lost their previous encounter with Bangladesh in the Ireland tri-series a few short weeks ago.

This will give the Bangladeshis confidence before their crucial Group A encounter with the Black Caps in Cardiff tonight. They will, however, have to contend with facing a very different Black Caps side to the one they beat in Dublin.

Most notably, the Black Caps will now have the presence of all of their four genuinely world-class players, with Martin Guptill, Kane Williamson and Trent Boult, all of whom missed the Ireland tri-series for IPL duty, rejoining Ross Taylor in the side.

This explains why the Black Caps are still the favourites to win the encounter on BetFair. They are only paying $1.33 compared to Bangladesh’s $3.90, making them heavy favourites.

Martin Guptill has looked very good in his two starts this tournament, but has been unable to go on and play a punishing innings. With Luke Ronchi likely to continue partnering him at the top, Bangladesh will be forced to take early wickets or risk getting hit out of the game.

With Kane Williamson and Ross Taylor completing the top order, the most likely outcome of the match appears to be the Black Caps top four batting the Bangladeshi bowlers – a class weaker than the English and Australian batteries – out of the game.

If they don’t, Bangladesh will feel confident of rolling the rest of the order. The Black Caps lost 7 for 37 against Australia and 8 for 65 against England, and Bangladesh know that if they can get Williamson in early and then out early, they will be in a very strong position.

The Black Caps might be tempted to fiddle with their middle order a bit, knowing that this has been their soft underbelly for a long time.

Neil Broom’s returns have been poor this tournament – only 11 and 14 – but he has averaged 43.53 since coming back into the Black Caps side last December. His position should be okay for now.

The real question is how to fit both of Jimmy Neesham and Corey Anderson in the team. It may be that one of them comes out for Colin de Grandhomme, who has shown the ability to come to the crease and start hitting straight away.

It may also necessary to drop Mitchell Santner below Adam Milne in the batting order, as Santner has had great struggles with the bat recently.

Another option is bringing Latham in to open and moving Ronchi back down the order.

Bangladesh may find it much more difficult to chase down scores like 271, as they managed to do in Dublin, because they will have to do it against Boult, Tim Southee and Adam Milne.

However, their batting down to 7 is much stronger than it has ever previously been in Bangladesh cricket history.

Tamim Iqbal is their strongest bat on recent form. In 30 matches since the last Cricket World Cup he averages 59.53 with the bat, and has scored over 200 runs in two innings so far this tournament.

Around him there are a number of very talented batsmen, in particular Sabbir Rahman, Soumya Sarkar, Mushfiqur Rahim and the allrounder Shakib al Hasan.

If they can keep Boult, Milne and Southee out with the new ball, as England managed to do, then it will be possible for them to milk a plethora of runs in the middle stages.

A major danger for Bangladesh is that if they fail to bowl New Zealand out, they may lack the hitting power to match them across 50 overs. Despite the talent in the Bangladeshi side it’s hard to see them chasing 300 or more, even in the most favourable circumstances.

All of this could be moot in the very real circumstances of rain, as a washout would see the Black Caps eliminated and Bangladesh with only a mathematical chance of progress.

For the winner, however, an Australian loss in their matchup against the bookies’ favourites England, or a washout in the same encounter, would see them progress to the semi-finals.

Considering the chaos in the other group, there’s every chance that they would then play a relatively soft team like Pakistan or Sri Lanka in the semifinal.

So there’s all to play for tonight.
Understanding New Zealand: Demographics of Flag Referendum Voters

Given what is already known about the demographics of the various party voters, we can tell a lot about who supported the flag referendum just by looking at the correlations between voting for a given party and one of three other major variables.

The first major variable is the turnout rate in the first flag referendum.

The correlation between turnout rate in this first referendum and voting National was a very strong 0.86. That is enough by itself to suggest that the bulk of the people who did end up voting in it were National supporters.

The correlation between turnout rate in 2014 and voting National was, however, 0.76, so we can see that the people who voted in the first flag referendum were mostly those who are generally inclined to vote whenever they can. This was also true for Conservative Party supporters, who had a correlation of 0.70 with turnout rate in the first flag referendum.

Green, ACT and New Zealand First voters were only mildly interested. The correlation between turnout rate in the first flag referendum and voting Green was 0.07, with voting ACT it was -0.01 and with voting New Zealand First it was -0.21. None of these were significant.

Labour Party voters were almost entirely indifferent to the whole idea. The correlation between voting Labour in 2014 and turnout rate in the first flag referendum was a very strong -0.84.

This was something broadly shared by all of the Maori-heavy parties. The correlation between turnout rate in the first flag referendum and voting for both the Maori Party and Internet MANA was -0.67, and with voting for the Aotearoa Legalise Cannabis Party it was -0.55.

Predictably, given these statistics, it was mostly Kiwis of European descent who were interested in the first referendum. The correlation between being of European descent and turnout rate in the first flag referendum was 0.85.

The correlation between turnout rate in the first flag referendum and being either Maori or a Pacific Islander was -0.65, and with being Asian it was -0.27.

Perhaps the most striking correlation of all is that between turnout rate in the first flag referendum and turnout rate in 2014 – this was an extremely strong 0.90. Those who like to vote tend to take every opportunity they can to actually do it.

There was also a correlation of 0.89 between turnout rate in the first flag referendum and median age.

The correlations between wealth and turnout rate were significant, but only marginally so.

All of the income bands above $70K were significantly positively correlated with turnout rate in the first flag referendum, but only marginally so – the strongest of them was 0.31. None of the income bands below $70K had a significant positive correlation with turnout rate in the first flag referendum.

By contrast, all of the income bands below $10K had a correlation of -0.50 or more strongly negative, the strongest of all being for those who had a negative income. The correlation between being in this income bracket and turnout rate in the first flag referendum was -0.84.

Likewise, the correlations between education and turnout rate bordered on statistical significance.

Although there were significant positive correlations between turnout rate in the first flag referendum and having either an Honours degree (0.25) or having a doctorate (0.27), this was true for neither a Bachelor’s nor a Master’s degree (both 0.13).

Mirroring this, the correlation between turnout rate in the first flag referendum and having no academic qualifications was not especially strong, at -0.28.

One of the strongest correlations of all was between turnout rate in the first flag referendum and living on freehold land: this was 0.87.

All of this gives us a clear picture. The sort of person who turned out to vote in the first flag referendum was the same sort of person who is most heavily involved in running the country: rich, old, white and National voting with leisure time.

The second major variable is the turnout rate in the second flag referendum. Here it is only really meaningful to speak of the differences in voting pattern to the first flag referendum.

Although the second flag referendum was still mostly a vehicle for Kiwis of European descent (the correlation between the two demographics strengthened from 0.85 to 0.88), the people who turned out for it tended to be more Maori. The correlation between turnout rate in the second flag referendum and being Maori came in to -0.57 from -0.65.

Against this, turnout rate for the second flag referendum faded among Pacific Islanders and Asians. This may have been because the further the process wound on, the more likely the least established Kiwis were to drop out of it.

People who voted Green were also less likely to turn out in the second flag referendum. The correlation between the two fell to 0.02 from the 0.07 of the first flag referendum. This was probably because the correlation between being in the 20-29 age bracket and turnout rate fell from the -0.41 of the first flag referendum to the -0.50 of the second.

All of this reflected the fact that the second flag referedum saw a considerably higher turnout rate among those who did not want to change the flag. The correlation with voting to change the flag fell from 0.86 for the first flag referendum to 0.80 for the second.

The third major factor is the percentage of people who voted to change the flag.

These people were almost all National voters. The correlation between voting National in 2014 and voting to change the flag in the second flag referendum was a whopping 0.95. This is an extremely strong correlation, and it tells us that basically the only people to even vote to change the flag were died-in-the-wool National voters.

Maoris really didn’t want to change the flag – the correlation between the two was -0.77. These numbers suggest that there was a small core of Maoris who knew from the beginning of the process that they didn’t want to change the flag, but who waited until the second flag referendum to voice their disapproval.

Asians were a curiosity, because they had a negative correlation with turnout rate in either referendum, but a slightly positive correlation of 0.11 with voting to change the flag.

Some will find it very curious that the old were much more likely to vote for change than the young, which goes against the usual pattern of the old being more conservative.

The correlation between being aged 65+ and voting to change the flag was a very strong 0.62, which is amazing if one considers that one of the arguments for keeping the flag in the first place was that old people had become accustomed to it over many years of living under it.

For their part, the young preferred to keep the flag. The correlation between being in the 15-19 age bracket and voting to change the flag was -0.53.

Some might find these latter points extremely interesting, because they support anecdotal evidence from overseas suggesting that the generation to follow the Millenials – those who some have dubbed Generation Z – are more conservative than their immediate predecessors.

This question will be revisited in the second edition of this book, to be written after the 2017 General Election!

*

This article is an excerpt from Understanding New Zealand, by Dan McGlashan, published by VJM Publishing in the winter of 2017.

Understanding New Zealand: Demographics of Income

Some demographic patterns of income will already be apparent from voting patterns, and others are well-known by all, but this section will go into details.

There is a significant correlation between median age and median personal income – this was 0.27. Many will have expected this correlation to be stronger, in much the same way that the correlation between median age and voting National in 2014 was much stronger. But age is not as closely correlated with wealth as other demographic factors are.

Indeed, while there were significant negative correlations between being in any of the age brackets 19 years or below, this can be simply explained by the fact that this age group is generally too young to work.

The correlation between being in the 20-29 age bracket and median personal income was essentially uncorrelated at 0.04. Of course, people in this age band will nonetheless end up with less money than the average Kiwi on account of paying relatively more of their income in rent.

The vast bulk of the income received by anyone in New Zealand is received by the 30-49 age bracket, which had a correlation with median personal income of 0.73. This is actually the only age bracket to even have a significant positive correlation with median personal income.

The correlation between being in the 50-64 age bracket and median personal income was 0.18 – positive but not significant. This age bracket may contain a large proportion of the people who are in highly paid C-suite positions, but the absolute numbers of these people are small, and they are outnumbered many times over by the people in this age bracket who have wound down to part-time work.

Being in the 65+ age bracket had a correlation of -0.02 with median personal income. Although this is actually less than what people in the 20-29 age bracket get, people who are 65+ are far more likely to live on freehold land, and as a consequence their expenses will be relatively low.

Kiwis of European descent were the only ethnicity to have a significant positive correlation with median personal income – this was 0.35. Asians, however, were marginally significant at 0.22.

Being a Pacific Islander had a correlation of -0.29 with median personal income, and being Maori had one of -0.48, which tells us that the average Maori is a fair bit poorer than even the average Pacific Islander, probably a reflection of the fact that it is more difficult for the Pacific Islander underclass to migrate to New Zealand.

The religious tradition with the strongest positive correlation with median personal income was Judaism, at 0.63. Buddhism and Catholicism were next, with correlations of 0.32 with median personal income, and then was no religion with a correlation of 0.27.

These correlations mostly reflect that people of the first three religious traditions are especially likely to have immigrated to New Zealand on the basis of the points system, which gives bonus points to any applicant that has a degree.

The significant positive correlation between median personal income and no religion was mostly because of the fact that the indigenous New Zealand subcultures that value education the most are the same ones that are most likely to reject religion.

Further underlying the point that our immigration system makes it easier for people with degrees to move here, we can see that there is a correlation of 0.53 between being born in Britain and median personal income, and a correlation of 0.33 between being born in North East Asia and median personal income.

Similarly, the correlation between median personal income and being born overseas in general was significantly positive, at 0.34.

Education is clearly the decisive factor, above anything else, that explains most of the variance in the incomes of New Zealanders.

The correlation between having no academic qualifications and median personal income was a very strong -0.68, and the correlation becomes more positive with every step upwards in education all the way up to having an Honours degree, which had a correlation of 0.72 with median personal income.

The crossover point was close to what used to be known as 7th form – the correlation between having a highest educational qualification of NZQA Level 3 or 4 and median personal income was 0.12.

What this describes is a very simple pattern: generally speaking, the greater a person’s intellectual capacity, the greater the responsibility they will be capable of competently discharging, and the greater the responsibility so discharged the greater the renumeration they will receive.

Basically the entire taxpayer-funded educational system is predicated on this pattern and it is fundamental, not just to New Zealand, but to human life.

The industry that had the strongest positive correlation with median personal income was scientific, technical and professional services – this was 0.76. Other well-paid industries were financial and insurance services (0.69), information media and telecommunications (0.54) and rental, hirinig and real estate services (0.49).

Naturally, these are the industries that have the most highly educated workers.

Being male was right on the border of being significantly positively correlated with median personal income, at 0.23. If one takes into account that men are more frequently active in the labour force than women, then the lack of significance of this correlation tells us the idea of the “gender gap” in renumeration is overstated.

Underlining the degree to which median personal income is correlated with education, which is a proxy for intelligence, we can see that median personal income also correlates strongly with other correlates of intelligence.

For example, the correlation between median personal income and being a regular smoker was a strongly negative -0.61, whereas with never having smoked it was 0.57.

Contrary to the stereotype, people who take the bus to work have a higher income than those who take a private vehicle to work. The correlation between median personal income and the former is 0.51, and the correlation between median personal income and the latter is -0.24.

Some will find this very surprising, but the fact is that people who live and work in major urban centres have much better access to both bus services and to the jobs that pay the highest wages, and the opposite is true of people who live in smaller centres where taking a personal car to work is more viable or necessary.

The occupation with the strongest positive correlation with median personal income was professionals at 0.68. Next were managers at 0.49 and clerical and administrative workers at 0.43.

The occupation with the strongest negative correlation with median personal income was machinery operators and drivers at -0.59. Next were labourers at -0.51 and community and personal service workers at -0.31.

It doesn’t really make a difference which island you live on – the correlation between living on the South Island and median personal income was 0.03.

*

This article is an excerpt from Understanding New Zealand, by Dan McGlashan, published by VJM Publishing in the winter of 2017.

Black Caps vs. Australia, Champions Trophy Pool Match Preview

Trent Boult demolished the Australian lower order the last time these two sides met in an ODI, taking 6-33. The Black Caps will need something similar to concede less than 350 against this strong Australian side

The Black Caps had mixed fortunes in the Champions Trophy warm-up matches, but that will all be forgotten when their first pool match starts, against World Cup final opponents Australia, this Friday at 9:30p.m. (NZT).

Australia is a solid favourite on BetFair to win this encounter in Birmingham. They are only paying $1.53 compared to $2.84 for the Black Caps.

The main reason for this is their superb bowling. Mitchell Starc and Josh Hazlewood are both ranked in the top 5 of ODI bowlers at the moment, and they will have both Pat Cummins and James Pattinson backing them up.

Because Starc is capable of batting 8, Australia might be tempted to go with all four of them in the same side – which would make for an exceptionally fearsome ODI pace battery, one of the strongest ever. There would be no respite.

The Black Caps may have three of their best ever ODI batsmen in the top 4 – Martin Guptill, captain Kane Williamson and Ross Taylor, but question marks remain over Guptill’s opening partner and the middle order.

A number of players were tried in these positions in the warm-up matches and in the preceding tri-series against Ireland and Bangladesh. The difficulty is that there were no performances that will have forced the hand of the selectors.

Guptill will open with either Luke Ronchi or Tom Latham. The desire from the brains trust might be to favour the big-hitting Ronchi, because English surfaces in recent years have tended towards very big scores.

A variety of players have been recently tried in the Black Caps middle order. Neil Broom, Corey Anderson, Jimmy Neesham, Mitchell Santner and Colin de Grandhomme are all possibilities for the middle order and allrounder slots.

The Black Caps bowling unit, however, is easy to select. The tried and true combination of Trent Boult (ranked 6th in the world for ODIs) and Tim Southee will no doubt share the new ball, and it’s likely that Mitchell McClenaghan will be in as third seamer.

McClenaghan’s T20 experience will help to lend him skills that are useful in death bowling, and he has been talked about in that role in particular. This should see him take the spot ahead of Adam Milne, who is improving rapidly but still lacks the knockout punch of the more established seamers.

The three seamers will be complimented by Mitchell Santner, whose relentless accuracy and subtle variations have seen him rise into the top 10 of ODI bowlers for the first time.

The Black Caps bowling strategy will be to take two or three poles early with the moving ball, and then to at least restrict the scoring in the middle overs with Santner and the variations of either McClenaghan or Milne.

This will lessen the potential impact of the Australians’ big middle order hitters like Chris Lynn, Travis Head, Glenn Maxwell, Marcus Stoinis and Matthew Wade.

The Australian batting lineup appears to be following the general ODI zeitgeist at the moment by being packed with hitters. Any of David Warner, Aaron Finch, Lynn, Head, Maxwell or Stoinis is capable of striking at well over 100 for as long as they can stay in.

Their strategy will probably be to use Steve Smith at 3 as the fulcrum around which the other batsmen can hit. If Smith can stay in long enough then the others around him can throw the bat and Australia will post a colossal score.

Considering that 300 has been a par score in England recently even for average sides, this match between the two World Cup finalists has the potential to see 700+ runs scored.

The winner of it will have the box seat in qualifying from this group, as they will probably then only have to beat Bangladesh in order to advance to the semifinals.