The Limits of Inclusiveness

Gay people are categorically unwelcome here

With news that Queensland Islamic authorities are urging their followers to vote “No” to same sex marriage, the levels of cognitive dissonance among many on the left are starting to become painful. It’s now undeniable that a grand coalition of everyone who isn’t a rich, straight white male is an untenable concept. This essay examines why.

For the past couple of decades, leftist groups across the world have looked for solidarity on the basis of “the enemy of my enemy is my friend.” This logic has inspired the “tolerant left” to make a show of solidarity towards any and all groups that had a grudge against the people running the world – commonly agreed to be rich, straight, white men.

This has led to the left adopting the idea of inclusiveness as a moral virtue. Any and all alliances with people who hated the Establishment had to be entertained. It didn’t matter if they were women, gay, black, Muslim or anything else, just as long as they wanted to overturn the status quo.

However, this grand political dream to remake the world in one’s image fell apart, as such schemes inevitably do, because it ran into inexorable silver laws of psychology.

It can be stated as a psychological rule that, the larger and more diverse any given group, the weaker the bonds of solidarity that hold it together will be, and the smaller and more pure any given group, the stronger those bonds of solidarity will be.

This is obviously true if we look at the extremes. At one far extreme we could consider the nuclear family to be the smallest group with the strongest solidarity. Parents are often ready to kill if that is necessary to protect their offspring, and “brother” is used as a gesture of common bonds in all kinds of ideological movements, so it’s easy to see how this small, extremely exclusive group has the highest solidarity.

The reason why you can’t just let a random person into your family and have them considered one of you is because this would increase the degree of diversity of the group to the point where such extremely strong bonds of solidarity are no longer tenable because the necessary level of trust isn’t there.

The obvious reason for this is because the already existing members of the family have next to nothing in common with a random person, so there’s no special reason to trust them.

At the the other far extreme we could consider the human species to be the largest group with the weakest solidarity. Indeed, we can see here that people generally don’t care at all if they hear that someone on the other side of the world died, unless that person had something in common with them, such as a native language or racial origin.

Further evidence for this can be observed if we place the nation states along a line with a familial level of solidarity (highly discriminating and strong) at one end and a universal level of solidarity (undiscriminating and weak) at the other.

Here it can be seen that the nations that cast the net of citizenship over an extremely broad set of different people (USA, Brazil, South Africa, Russia) have the lowest levels of solidarity, measured by the unwillingness of the wealthy to contribute to the communal welfare in the form of taxes, and by the willingness with which the poor use lethal violence on other citizens.

It can also be seen that the nations that cast this net more exclusively, such as only over a small, homogenous ethnic group (Scandinavia, Japan, Germany, South Korea, Canada), have the highest levels of solidarity, measured by an egalitarian culture and low levels of interpersonal violence.

Fitting this trend, countries with moderate levels of diversity (Argentina, Britain, Australia, New Zealand, Chile) are in the middle.

There’s no escaping this silver law: the more inclusive the group, the weaker the bonds of solidarity, and the less inclusive the group, the stronger the bonds of solidarity.

The idea of trying to include as many people in the wider group as possible is essentially a feminine idea, and this is why it is generally associated with the left. It’s a form of horizontalisation that seeks to remove all distinctions from people in order to homogenise us into an easily malleable ball of putty.

However, we can now see the limitations of it. The motivation behind this idea is ostensibly to avoid making people feel bad on account of being excluded, but the flipside of it is that no-one ever feels good on account of being included.

This has led to a situation where Muslim immigrants, considered by the trend-setters among the left to be allies on account of a mutual Christian enemy, will vote against the rights of other leftist allies if those allies are homosexuals. It is a tremendous irony that these religious fundamentalists, allowed into the country because of a desire to display the virtue of tolerance, do not share the belief in the value of that tolerance, and so are now acting to maintain intolerance towards groups they consider outsiders.

With the recent wave of immigration having made our societies much more diverse, we have correspondingly lost much of the solidarity that used to provide us with a sense of society and community. The net has been cast so wide, thanks to a fanatical ideology that believes it can erase all human uniqueness, that it cannot keep hold of what it covers.

In other words, the inevitable consequence of trying to treat everyone like your brother is that your brother can no longer count on a brotherly level of exclusive solidarity from you, and will have to settle for much less. People who believe that inclusiveness is necessarily a virtue might therefore want to be careful what they wish for.

Should We Lower Women’s Pensions to Bridge The “Gender Death Gap”?

The average Kiwi female enjoys 26% more life post-retirement than the average Kiwi male – this is dubbed the “gender death gap”

The national consciousness is currently in a state of hysteria over an Auckland electrician’s decision to offer a 12% discount to female customers on account of New Zealand’s “gender wage gap”. For those of you not in the matrix, the gender wage gap refers to the fact that the average weekly income of a woman is lower than the average weekly income of a man.

Although Dan McGlashan proved in Understanding New Zealand that the wage gap is entirely due to the fact that men work full-time jobs more often and the women work part-time jobs more often, and that there is no difference in wages for those men and women who are part of the professional class, the perception persists that women are deliberately ripped off in remuneration for their labour by some nefarious conspiracy of people with Y chromosomes.

Some, like the Auckland electrician mentioned above, seem to believe that this perception of a malevolent bias against women justifies giving women discounts when it comes to trade, in an effort to redress the imbalance in wages.

The real injustice when it comes to differential treatment of the genders is that women live much longer than men do. Females born today are expected to live 3.7 years longer than men do, an injustice many times more cruel than a piddling difference in wages.

The average female can expect to live 83.2 years from birth, whereas the average male can not even count on getting to 80. His average life expectancy is only 79.5.

Another way of looking at it is that the average female gets another 18.2 years of life after hitting retirement age at 65, compared to the paltry 14.5 years of the average male.

Measured in percentages, this means that the average female gets to enjoy 26% more life in their golden years than the average male. This is a disparity that weighs much heavier than that of mere money. Here we are talking about life itself.

We can call this disparity the “gender death gap”. Knowing about this gap in life expectancy, and knowing that there are tireless calls for restitution from working age men on account of the gender wage gap, one question immediately arises: should we call for restitution from pension age women?

It could be argued that, if tradesmen like the electrician mentioned earlier give discounts to working age women on account of the gender wage gap, they also should give discounts to pension age men. After all, the clock is ticking for those men in a way that does not compare to the experience of the female.

Perhaps the fairest solution would be to immediately cut female pensions by 26%, which would equalise the amount of post-retirement money that the different genders got out of the Government.

How Well Did The Economy Do Under John Key?

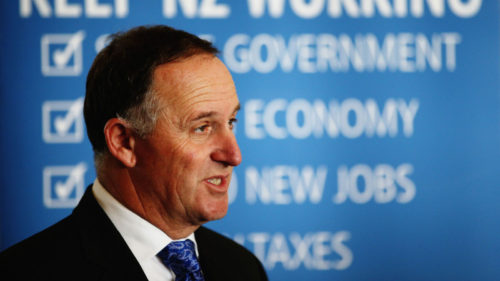
John Key: made New Zealand wealthier compared to other nations, but not by as much as Helen Clark did

This article starts with a very straightforward proposition: that the prosperity of an economy and of the people in that economy is primarily a question of GDP per capita. Given that, we can measure the increase in New Zealand prosperity (if any) under John Key’s tenure by looking at the change in GDP per capita during that time.

The figures that this article uses are taken from the International Monetary Database. Here we calculate GDP on a price purchasing parity basis because we are ultimately trying to measure the change in standard of living.

In 2009, the GDP per capita of New Zealand was USD30,572. This placed us 37th in the world, just behind Italy, Japan and Spain, and just ahead of Greece, South Korea and Israel.

In 2016, the GDP per capita of New Zealand was USD37,294. This placed us 35th in the world, just behind South Korea (who leapfrogged us), Japan and Finland, and just ahead of Italy and Spain (who we leapfrogged) and Israel.

This makes for an increase of 22% over 7 years, which is about 2.9% per year if calculated on a compounding basis.

2.9% over a seven-year period can rightly be considered a decent effort of national economic stewardship from Mr. Key. That level of growth is far from remarkable, but it was enough to move us past a Southern European level of wealth and close to a Far East Asian level.

By way of comparison, the GDP per capita of New Zealand in 2000 was USD21,807, which makes for a 40% increase over the nine years of Helen Clark and Michael Cullen. This works out to just over 3.7% per annum.

Measured that way, the performance of the John Key economy was markedly poorer than the Clark/Cullen economy. However, one has to take into account that Key inherited a global financial crisis, and so it’s worthwhile comparing New Zealand to other nations instead of looking at absolute growth.

In the year 2000, New Zealand was considerably less wealthy than Italy (which had a GDP per capita of USD28,602), Japan (USD26,850) and Spain (USD24,053). It was also less wealthy than Australia (USD28,801), Britain (USD26,425) and America (USD36,433).

By 2009, the GDP per capita of New Zealand had increased from 76% of that of Italy to 89%; from 81% of that of Japan to 92%; and from 91% of that of Spain to 96%. Against other Anglo nations, the GDP per capita of New Zealand had decreased from 76% of that of Australia to 75%; had increased from 83% to 87% of that of Britain; and increased from 60% to 65% of that of America.

This means that under the Fifth Labour Government, New Zealand improved its position strongly against comparable countries, with the exception of the booming Australia.

By 2016, the GDP per capita of New Zealand had increased from 89% to 101% of that of Italy; had decreased from 92% to 90% of that of Japan; and had increased from 96% to 102% of that of Spain. Against other Anglo nations, the GDP per capita of New Zealand had increased from 75% of that of Australia back up to 76%; had increased from 87% to 88% of that of Britain; and remained at 65% of that of America.

This tells us that under the Fifth National Government, New Zealand improved its position against the Southern European countries but stayed the same compared to other Anglo ones.

Ultimately, therefore, we can see that New Zealand’s economic standing in the world is marginally better, in relative terms, after the Key Administration. Apart from the decline of Italy, New Zealand didn’t really improve in relative wealth. This contrasts sharply with the years under Helen Clark, during which time New Zealand improved strongly.

The Ten Strongest Positive Correlations in New Zealand Society

In 1847 most Kiwis smoked all the time, but by 2017 the correlation between being Maori and being a regular tobacco smoker had become 0.922

Dan McGlashan’s Understanding New Zealand is currently undergoing final preparations for publication and release. This means that the most comprehensive demographic survey of New Zealand ever conducted is about to be available to Kiwi readers in paperback form!

As a sample of what is in the full version of Understanding New Zealand, this article looks at the ten strongest positive correlations in this study, out of all 9,870 of them.

10. Working in professional, scientific and technical services and having an income between $100 and $150K had a correlation of 0.918. This is not very surprising at all, because it is well known that working in any of those occupations requires a very high level of knowledge and skill and that is usually well compensated.

9. Working in financial and insurance services and working in professional, scientific and technical services had a correlation of 0.920. Obviously a person can’t work in both, but the reason for this strong correlation is that both industries are almost exclusively confined to the central city electorates of Auckland, Christchurch and Wellington.

8. Being Maori and being a regular tobacco smoker had a correlation of 0.922. This is an astonishingly strong correlation if one considers that there is no known racial inclination to smoke tobacco.

The reason for it is probably because people generally need to be doing it quite hard to smoke tobacco, because its medicinal effects are outweighed by the physical damage unless a person is under severe emotional distress.

For these reasons, because the majority of the people who are doing it the hardest are Maoris, it’s also the case the majority of Kiwis who are currently regular tobacco smokers are Maoris.

7. Being a Hindu and being a Muslim had a correlation of 0.929. Like point 9 of this list, the two categories are mutually exclusive, and therefore the correlation represents the high physical proximity that the two groups live in.

The explanation for it is that both Hindus and Muslims are part of the most recent waves of immigrants, and so the vast majority of both groups live in the same neighbourhoods, in particular poor ones in Auckland.

6. The correlation between voting ACT in 2014 and being born in North East Asia was 0.937. This might seem like a very strange statistic until one considers that much of a person’s voting preference is a function of two factors – their degree of solidarity with other Kiwis and how much that solidarity will personally cost them.

Anyone not born in New Zealand will necessarily have the least amount of solidarity with other Kiwis on account of having the least in common in terms of heritage and culture, and those born in North East Asia are usually earning an income at or above the Kiwi average – and so pay more taxes.

Thus it can be seen that the ACT Party, in that it most unashamedly considers money more valuable than people, attracts the bulk of these voters.

5. The correlation between being Congregational or Reformed and being born in the Pacific Islands was 0.943. This is because this group reflects a religious tradition that is extremely popular in all of the Pacific Islands apart from New Zealand.

4. The correlation between being Buddhist and being Asian was 0.950. Some might find this surprising because they know a lot of non-Asian Kiwis who are “really into Buddhism”.

Few of these people, however, would go as far as identifying with Buddhism when they fill out the census forms – unlike Asians born in Thailand and in other countries where Buddhism is mainstream, of whom there are tens of thousands in New Zealand.

2=. The second strongest positive correlation was between voting National in 2014 and voting to change the flag – this was 0.954. As Section 56 of Understanding New Zealand discusses in detail, the entire flag referendum project was essentially a National Party vehicle.

2=. Equal with this was the correlation between being a Pacific Islander and being born in the Pacific Islands. A correlation of 0.954 here tells us that, not only are the bulk of Pacific Islanders in New Zealand not born here, but that they tend to choose to live in geographical areas full of other Pacific Islanders (in particular South Auckland).

Although many Kiwis of Pacific Island descent are born in New Zealand, many of these have moved out of Auckland and therefore away from the bulk of those born in the Pacific Islands. These two factors explain this extremely strong correlation.

1. The strongest positive correlation in all of New Zealand was that between voters in the first flag referendum and voters in the second flag referendum – this was a whopping 0.985.

This combines the fact that the entire project was a National Party vehicle with the fact that those who like to vote tend to take every opportunity they can to do so.

*

This article is an excerpt from Understanding New Zealand, by Dan McGlashan, published by VJM Publishing in the winter of 2017.