The Boringest T20I Is Worse Than The Boringest ODI

Scoreboard pressure in often so intense in T20s, especially at international level, that one misstep puts the chasing side in a hopeless position

In much the same way that cricket analysts were slow to catch on to the importance of strike rate in ODIs, so too have they been slow to catch on to the importance of strike rate in T20s. Everyone knows strike rate is important in limited overs; what few understand is how this can lead to extremely boring matches. This article looks at why efforts to contrive a more interesting game of cricket have only somewhat succeeded.

The advent of T20 came about when someone realised that, all other things being equal, fans liked seeing boundaries and wickets, and didn’t much care for dot balls or for contests that were over long before they technically finished because the chasing side lost early wickets. And so a form of the game was contrived to have as few dot balls as possible, and as many boundaries and wickets as possible.

But what this new fashion risks losing sight of is the fact that cricket is only interesting in the first place because it is a contest of skill, and sometimes the nature of the match situation in T20 is not conducive to playing the game skillfully.

For instance, it almost never occurs in ODIs that the chasing team, in the first five overs, falls so far behind the required strike rate that the match is effectively lost without resorting to slogging. The chasing team might lose early wickets, which makes the chase much harder, but as long as they can keep their wickets intact there are still plenty of overs in which to win through playing proper cricket and building an innings.

In T20s it’s common for the chasing team to build up enough scoreboard pressure in the first five overs that they effectively cannot win. In other words, it’s possible to lose the game with the bat in the first five overs because of scoreboard pressure – something that is near to impossible in ODIs.

This can happen if the team setting a total bats well enough that they’re close to the optimal possible run rate over the 20 overs (which is usually somewhere just above 10 an over, a rate that cannot realistically be maintained for an ODI). When the required run rate for the batting team climbs above this, it cannot be achieved without taking risks (i.e. slogging) and when this happens one is no longer playing cricket. It’s no longer a contest of skill but merely hit and hope.

This is an incredibly boring outcome from the spectator’s point of view, because the beauty of cricket is that it is a contest of skill where the batsman must find a balance between aggression and keeping his wicket intact. Removing the “keeping the wicket intact” part of the equation often reduces the game to slogging.

It has happened twice in the two matches of the T20I series between New Zealand and India so far.

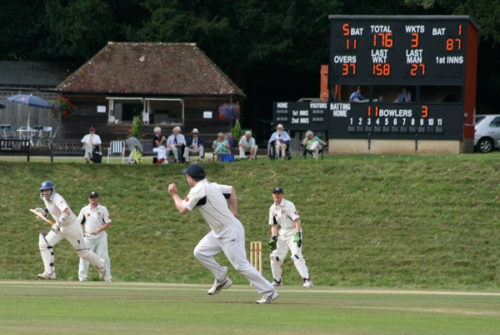
In the first T20I in Delhi this week, Shikhar Dhawan and Rohit Sharma both scored 80 at strike rates of 145+ opening the India innings, which allowed them to finish on 202, more than 10 runs an over. This asking rate was so high that the slightest stumble in the chase would see the match over as a contest.

And it duly was effectively over, 22 balls into the chase after Munro and Guptill had both been dismissed. At this point the equation was 185 runs off 98 balls and Kane Williamson and Tom Latham, for all their undoubted skill as batsmen, couldn’t do much about it because neither could slog at the required rate.

Once a T20 match gets to this stage it gets ugly, because batsmen have no time to get used to the conditions so as to play big innings where they strike the ball skillfully and with timing into gaps in the field. So after Williamson and Latham were dismissed, Colin de Grandhomme had to come in and slog his first ball, which got him out.

In last night’s T20I at Rajkot, the contest was effectively over in the second over of the chase after Trent Boult had taken two wickets. Colin Munro clubbed his way to 109* (58) in the first innings, which meant that the slightest stumble would put the total out of reach.

And it duly was effectively over after Boult’s second, which meant they needed 10.5 an over for the remaining 18, or an individual strike rate of 175, with their two best hitters out. None of their batsman managed this, as few do.

The remaining batsmen were unable to score at the required strike rate without throwing their wickets away, and so limped to a loss, effectively throwing in the towel long before the innings concluded.

In ODIs strike rate is a major factor, but strike rate seldom destroys the chasing team’s hopes as quickly, as ruthlessly and as completely as in T20Is. Scoreboard pressure can destroy a chasing team’s chances so quickly that players can be forced into mindless slogging, and this is much less interesting to watch than a balanced contest between bat and ball.

The Black Caps T20 side already can’t find room for batsmen of the quality of Ross Taylor and Tom Latham, because they can’t (or don’t) slog enough. This means that the viewer is watching batting of a lower level of skill just because the way the T20 format is contrived promotes such. This is also not interesting from a viewer’s perspective.

The real horror scenario is this – what if it is decided that strike rate is so important in T20Is that there’s no room in the side for Kane Williamson? Because if this day ever comes, T20Is might start to be considered a joke format by cricket fans in the same way most rugby union fans consider sevens, or at least one only suited for levels below international.

If the joy of sport comes from watching skill on display then it can be argued that T20Is are objectively more boring than ODIs because they objectively give less opportunity for the batsman to display skill. The overwhelming importance of strike rate means that skillful cricketers are often pushed out of the side by sloggers, which are only fun in small amounts.
New Zealand in India ODI Series 2017, First ODI Preview

Colin Munro’s T20 form has seen him elevated to open for the ODI side in the hope that he can replicate Brendon McCullum

A lot of things are going against the Black Caps before their One Day International series against India in India starts tonight (Sunday) at 9p.m. NZT. Ominously, India sit atop the ICC ODI team rankings table, equal to South Africa with 120 ratings points, while the Black Caps are currently a mid-table side at 5th. Worse, the matches are in India, where India just demolished the world champion Australia side 4-1.

On the other hand, a lot is going in their favour. New Zealand scored 343/9 in their last warm-up match against an Indian Board President’s XI, with centuries to Ross Taylor and Tom Latham, who in all likelihood will comprise the 4-5 axis over the series. Considering that Kane Williamson will bat at three, this suggests that India might have difficulty bowling the Black Caps out.

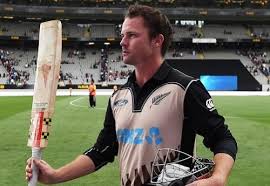
Colin Munro is expected to open the batting with Martin Guptill, which is an experimental measure intended to fill the gap left by Brendon McCullum at the top of the order. McCullum’s explosive starts made it possible for Williamson and Taylor to build innings without risk, and Munro has a T20 strike rate of close to 150 – close to what McCullum was striking at for the last 2 years of his ODI career.

It looks as though Williamson will try and get 10 overs out of Colin de Grandhomme, who will bat 7, and with Latham at 5 doing the wicketkeeping this leaves a spot for a pure batsman at 6. This spot might get filled by Henry Nicholls, as it was during the final warm-up match, or the Black Caps might start playing hitters from there, which would probably mean Glenn Phillips.

The other question mark is whether or not Tim Southee is still good enough to command a starting spot in this ODI squad. Although he has been a first-choice seamer for a handful of years, his ODI bowling average over the past three years – which includes the great run at the 2015 Cricket World Cup – is 36.47, which is only good enough for 33rd place on the official ODI bowling rankings.

Damningly, there are four players from Afghanistan alone higher than Southee on the official rankings, which is probably not good enough for a Black Caps side that made the final of the last Cricket World Cup and is aiming to go one better in England in 2019.

It’s very possible that the Black Caps play two spinners on the slow Indian decks, which means they take both Mitchell Santner and Ish Sodhi. Assuming then that they still need de Grandhomme at 7 for the sake of the batting, and that Trent Boult is undroppable, that means Southee will be competing with Adam Milne and Matt Henry for that second seamer’s position.

India, for their part, have two extremely crafty bowlers. With the new ball is Jasprit Bumrah, who isn’t quick but has a Nathan Bracken-style range of subtle variations that make him hard to hit off the square, and with the older ball is Axar Patel, whose wily orthodox is also a difficult proposition on Indian surfaces.

The likely winning of the game, however, will be in India’s power-packed top order. They have four batsmen ranked in the top 14 in the world, with two of them – Virat Kohli and Rohit Sharma – ranked higher than Kane Williamson. Kohli averages a monstrous 55.13 from almost 200 matches, and getting rid of him early is simply a necessity if the Black Caps are to win.

Alongside them are the silky skillful Ajinkya Rahane and the brutal Shikhar Dhawan at the top and MS Dhoni with his 50+ average down the order. India have also found a genuine allrounder in Hardik Pandya so have no obvious weaknesses anywhere.

The Black Caps are only playing three ODIs and they are paying $3.80 on BetFair to win the first one, compared to India’s $1.35. This suggests that the market is expecting a 2-1 or 3-0 win to India.

Who Voted for the Ban 1080 Party?

Of all the smaller parties in the 2017 election, the Ban 1080 Party might be the strangest of them. There are other small single-issue parties – the Aotearoa Legalise Cannabis Party being foremost of these – but even these other parties have equivalents overseas. Who are the Ban 1080 Party, and what do we know about their 3,005 voters?

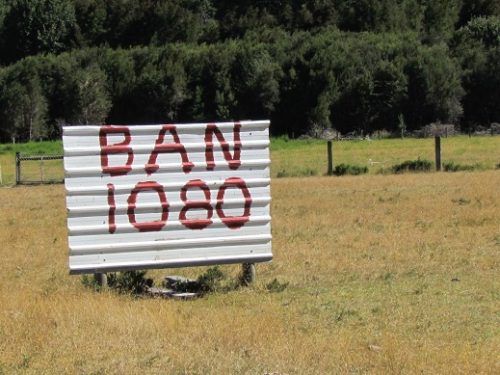
The Ban 1080 Party website argues for the need to stop making aerial poison drops that use sodium monofluoroacetate (1080) in New Zealand’s national parks and forests. The website’s tagline is “Protect our native birds” and they believe that aerial 1080 drops are a risk to the wellbeing of New Zealand’s birdlife.

A strong South Island focus was evident from the correlation matrix – the correlation between voting Ban 1080 Party in 2017 and living on the South Island was 0.37. The reason for this is probably because a greater proportion of South Islanders will live in the vicinity of a national park or a forest than North Islanders, who are much more urban on the whole, and it’s these people who access the outdoors who are most concerned about things like aerial poison drops.

This explain why the Ban 1080 Party also correlates strongly with other demographics that are well-represented on the South Island. The correlations between voting Ban 1080 in 2017 and other demographic categories were 0.34 for being a Kiwi of European descent, and 0.22 with median age. The only age bracket with a significant positive correlation with voting for the Ban 1080 Party was the 50-64 age bracket – the correlation here was 0.38.

If we examine measures of class we can see that Ban 1080 Party voters are poorer and less educated than the national average, which is especially striking if one considers that they otherwise belong to demographics that are positively correlated with wealth.

The correlation between voting Ban 1080 Party in 2017 and median personal income was -0.23, and the correlation between voting Ban 1080 Party in 2017 and having no NZQA qualifications was 0.44. Related to this is a correlation of 0.30 between voting Ban 1080 Party in 2017 and being a regular tobacco smoker. This paints a picture of a section of the community who are relatively simple people and who perhaps have been taken in by the hysteria a bit.

The rural nature of Ban 1080 Party voters is demonstrated starkly when it comes to the correlations between voting for them in 2017 and working in the agriculture, fishing and forestry (0.67) or mining (0.69) industries. There was also a significant positive correlation of 0.35 between voting for Ban 1080 Party in 2017 and working in the hospitality industry.

These three correlations reflect the high proportion of Ban 1080 Party voters who were enrolled in either the West Coast-Tasman or Clutha-Southland electorates.

Underlying that Ban 1080 Party voters are comprised of the outdoorsy kind of person who spends a lot of time in national parks and forests, there are significant positive correlations between voting Ban 1080 Party in 2017 and both being born in New Zealand (0.46) and being male (0.35).

Ironically, given their heavy conservation focus, the Ban 1080 Party does not attract followers who are like the Green followers. The correlation between voting Ban 1080 Party in 2017 and voting Green in 2017 was -0.09.

People who voted Ban 1080 Party tended to overlap with those who voted New Zealand First and, oddly, Aotearoa Legalise Cannabis Party. Voting for the Ban 1080 Party in 2017 had a positive correlation with voting for either of these parties: 0.41 for New Zealand First and 0.28 for the ALCP.

Part of the reason for this is the high level of Maori support for the party. This might sound contradictory, given that most Maoris live on the North Island, but a couple of statistics make this association clear. The first is the correlation between voting Ban 1080 Party and being Maori, which was 0.16, and the correlation between living on the South Island and being Maori, which was -0.26.

This tells us that South Island Maori were proportionately big supporters of the Ban 1080 Party, which is fitting considering that this demographic is extremely active in the outdoors with hunting and food gathering.

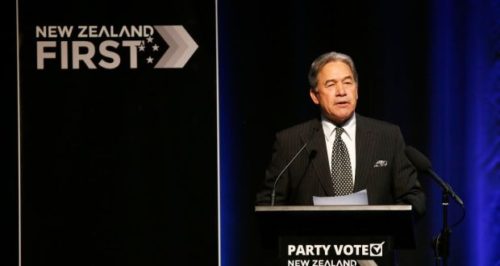
Who Voted New Zealand First in 2017

New Zealand First voters are generally drawn from the hard-done-by segments of the population

A previous article in this column examined the differences between New Zealand First voters and the voters of both National and Labour. It turns out that New Zealand First is almost equidistant from the two major parties if measured demographically. This article, however, looks more closely at who voted for New Zealand First in particular.

Despite being considerably whiter than it was in 2014, New Zealand First is not a particularly white party. In 2014 there was a correlation of 0.00 between voting New Zealand First and being a Kiwi of European descent. By 2017 this had climbed to 0.21, which was still not significant.

The strongest correlation between being of a particular ethnicity and voting New Zealand First was with being Maori, which was 0.38. The correlations between voting New Zealand First in 2017 and being a Pacific Islander (-0.21) or being Asian (-0.52) were much more negative.

Tellingly, for a nationalist party, their strongest support was from Maoris, who have the strongest roots in the country as essentially none of them are immigrants. Their next strongest level of support was from Kiwis of European descent, who have the second-deepest roots in the country, and their weakest level of support was from Asians, who have the shallowest.

As in 2014, New Zealand First voters in 2017 were some of the least educated out of any voting bloc. The correlation between having no NZQA qualifications and voting New Zealand First in 2017 was 0.67, and the correlation between having a doctorate and voting New Zealand First in 2017 was -0.60. This tells us that New Zealand First voters are decidedly working-class.

True to stereotype, there was a strong positive correlation of 0.58 between voting New Zealand First in 2017 and being on the pension, but there was also a strong positive correlation of 0.47 between voting New Zealand First in 2017 and being on the invalid’s benefit.

All of this suggests that the easy story of New Zealand First being an old racist’s party is somewhat misguided – it’s true that they do get many votes from poorly educated old white people, but that’s more because New Zealand First gets a lot of votes from hard-done-by people in general and poorly educated old people tend to be limited to their pension and therefore hard-done-by.

Gareth Morgan’s personal antipathy towards Winston Peters was reflected in the correlation of -0.31 between voting The Opportunities Party in 2017 and voting New Zealand First in 2017. This put TOP in a band with United Future (-0.27), ACT (-0.34) and the Greens (-0.48) as parties whose voters did not correlate highly in a general demographic sense with the voters of New Zealand First.

All four of those parties are particularly Pakeha-heavy parties, and ACT, the Greens and TOP appealed heavily both to young and educated people. So there is plenty of reason for these reasonably strong negative correlations.

There were positive correlations between voting New Zealand First in 2017 and voting for any of the Maori-heavy parties in 2017. These were Maori Party (0.11), MANA (0.24) and Aotearoa Legalise Cannabis Party (0.40).

Many will be surprised that there is a moderately strong positive correlation between voting New Zealand First in 2017 and voting Conservative Party in 2017 – this was 0.38. The reason for this is that both parties appeal to the large faction of poorly-educated old white voters mentioned above.

Despite the shared appeal to old white people, however, the correlation between voting National in 2017 and voting New Zealand First in 2017 was only 0.04, far from being significant. The reason for this is the class difference – the National Party appeals to people who are doing well economically (and most of these people are old), whereas New Zealand First appeals to people at the bottom of the ladder (and poor old people with no realistic way of becoming wealthier are definitely near the bottom).

*

This article is an excerpt from the 2nd Edition of Understanding New Zealand, which Dan McGlashan and VJM Publishing will have ready for sale at the end of October 2017. This will contain statistics calculated according to the official final vote counts and will be freshly updated with data from the 2017 General Election.