
Understanding New Zealand: City vs. Country

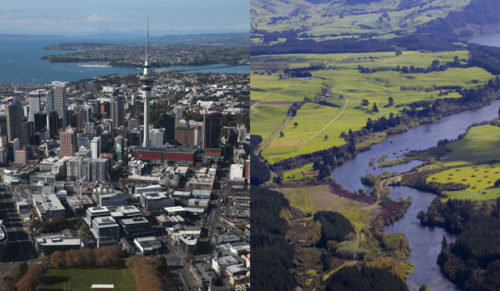
The division between city people and country people is one of the most telling in all of ethnography, and has been since the start of history. This is as true for New Zealand as it is for anywhere else. In this study, Dan McGlashan, author of Understanding New Zealand, looks at the statistical differences between people who live in the big cities (Auckland, Tauranga, Hamilton, Wellington, Christchurch and Dunedin, referred to here as “Living Urban”) and people who live in the provinces.

This study defines “City” electorates as any belonging to the following list: Auckland Central, Christchurch Central, Christchurch East, Dunedin North, Dunedin South, East Coast Bays, Epsom, Hamilton East, Hamilton West, Helensville, Hutt South, Ilam, Kelston, Mana, Mangere, Manukau East, Manurewa, Maungakiekie, Mt Albert, Mt Roskill, New Lynn, North Shore, Northcote, Ohariu, Pakuranga, Port Hills, Rongotai, Tamaki, Tauranga, Upper Harbour, Wellington Central, Wigram and Tamaki Makaurau.

These electorates tell a story that seems paradoxical on the surface. City dwellers are wealthier than provincial New Zealanders (the correlation being Living Urban and Median Personal Income was 0.37), but they are disinclined to vote for the wealthy party, National (the correlation between Living Urban and voting National in 2017 was, at -0.01, almost perfectly uncorrelated).

Urban people like to vote for the ACT and Green parties more than any others. The correlation between Living Urban and voting ACT in 2017 was 0.37; for Living Urban and voting Green in 2017 it was 0.36. The main reason for this is that young and trendy people support these parties, and young and trendy people live in urban areas.

The strongest negative correlations with Living Urban and voting for a particular party in 2017 were for New Zealand First (-0.60), voting Ban 1080 (-0.52) and voting Aotearoa Legalise Cannabis Party (-0.40). These three could be said to be the truly rural parties.

The two major parties both spanned the rural-urban divide. As mentioned above, urban dwellers do not vote National any more than rural dwellers do, but the grip of the Labour Party on the urban electorates is overstated. The correlation between Living Urban and voting Labour in 2017 was not significant, at only 0.11.

On a racial basis, it’s immediately clear that most rural people are Kiwis of European descent and Maoris, whereas most Pacific Islanders and the vast majority of Asians live in an urban setting. The correlation between being a Kiwi of European descent and Living Urban was -0.28, and between being Maori and Living Urban it was -0.35. This tells us that rural New Zealand is still very much a bicultural affair.

The correlation between being a Pacific Islander and Living Urban was significantly positive, at 0.33, and for Asians the correlation was strong, at 0.60. The reason for this is primarily because these two groups comprise the most recent waves of immigrants, and immigrants tend to establish themselves in major centres first before moving to the provinces. Indeed, the correlation between Living Urban and being foreign-born was 0.61.

Further clues appear when we examine the correlations between living in a big city and age. The correlation between Living Urban and median age was -0.23, on the border of significance, which tells us that the average city dweller is somewhat younger than the average country dweller. However, there were negative correlations between Living Urban and being in either of the youngest two age brackets, between ages 0 and 14 in total.

There were moderately strong correlations between Living Urban and being in either the 20-29 age bracket (0.50) or the 30-49 age bracket (0.51). These are also the age brackets that correlate the most highly with working fulltime and with median personal income. The correlations between Living Urban and being in either of the 50-64 or 65+ age brackets are both significantly negative.

What this tells us is the age-old story of young adults moving to the city for the sake of jobs and wealth, and then moving back out into the provinces again when it’s time to retire or perhaps to raise a family. This pattern of human migration, from country to city and back again, goes all the way back to at least Babylon, so it’s not surprising to find statistical evidence of it in contemporary New Zealand.

Keeping with the theme of employment, we can see that having any of the university degrees is significantly correlated with Living Urban (Bachelor’s at 0.63, Honours at 0.56, Master’s at 0.62, doctorate at 0.48). As described elsewhere, the reason for this is because of the strong correlation between having a university degree and working full-time.

In short, all the capital is in the cities, therefore that’s where the full-time jobs are, therefore anyone wishing to save money (as young, educated people tend to do) must live in an urban area. Indeed, there is a positive correlation (although not a significant one) of 0.18 between Living Urban and working in a full-time job.

This explanation is reinforced if one looks at the correlations between working in capital-intensive professions and living in an urban environment. The correlation between Living Urban and working in a particular profession was 0.58 for professional, scientific and technical services, 0.59 for information media and telecommunications and 0.61 for financial and insurance services. Notably, it was -0.72 for agriculture, forestry and fishing, for obvious reasons.

There was a significant positive correlation between Living Urban and renting one’s house (0.30) and a significant negative one between Living Urban and living in a freehold house (-0.31). This ties in with the observation that people in big cities have a different attitude to wealth generation: they are likely to become educated and earn a large wage with heavy expenses, whereas rural people tend to consolidate and grow wealth by minimising expenses.

Indeed, while there was virtually no correlation (0.01) between Living Urban and being unemployed, there was a significant correlation (0.27) between Living Urban and working for a wage or salary. This also ties in with the aforementioned fact that the jobs on offer tend to be where the major accumulations of capital are.

*

Dan McGlashan is the man with his finger on the statistical pulse of New Zealand. His magnum opus, Understanding New Zealand, is the complete demographic analysis of the Kiwi people.

For the House-Buying Power of 26 Years Ago, The Average Kiwi Wage Would Have to Be $79.25/hr Today

Housing is commonly left out of inflation measures, which is why low inflation rates are always reported. Unfortunately for Kiwis, the reality is that housing costs make up a large and ever-growing proportion of our expenses. This study will show that the average house-buying power of the average Kiwi worker is less than 40% of what it was 26 years ago.

The average house price in New Zealand on the 31st of January 1992 was $105,000, according to Real Estate Institute of New Zealand figures. This is as far back as figures go – 26 years. The average wage in New Zealand was $14.72 in the first quarter of 1992, according to Trading Economics. Assuming a 40-hour workweek, this works out to an average weekly wage of $588.80.

If a person saved 50% of their average wage in 1992, they would save $294.40 a week, which would be $15,351 per year. This would allow that person to buy the average New Zealand house after 6.84 years. So a person who completed university at the end of 1991, at age 21, and got a job at the average wage with their Bachelor’s degree, could expect to own an average house, mortgage-free, before age 30.

Saving half of one’s income is some feat, however, especially if one also has to pay rent or a mortgage. Saving 25% of the average wage, a more attainable proportion, would see a person in 1992 save $147.20 a week. This would be $7675 per year, which makes the average house attainable after 13.68 years.

Still, that means that in 1992, anyone who was willing and able to work at the average wage could own their own house outright within 13.68 years if they could only save a quarter of their income. This means by age 35 if they graduated from university at age 21 and saved a quarter of their income after then. Easy times.

In 2018, things are very different. The average wage has now gone up to $31.08 by the second quarter of 2018, but the average house price has jumped to $560,000 in those 26 years.

Using the example above, a person who qualified from university at the end of 2017 at age 21, and who immediately got a job at the average wage, would earn $1,243.20 per week. 25% of this is $310.80, which works out to $16,206 per year. Because the average house price is now $560,000 in New Zealand, that means that the average Kiwi worker now has to work for 34.56 years before they can expect to own their own house outright.

This means that the average Kiwi in 2018, even if they graduated at age 21 straight into an average wage and saved 25% of their income perpetually, still couldn’t afford to own the average house freehold until age 55, whereas such a thing was attainable 26 years ago by age 35. The middle-class dream is now dead in New Zealand. Kiwis are now tenants in what used to be our own country, enslaved by capital.

Another way of looking at this grim equation is that the average wage in 2018 has a mere 39.6% of the average-house-buying power that the average wage had in 1992. Even a person who managed to save 50% of the average wage from age 21 – a frankly incredible feat in today’s economy – couldn’t own the average house until age 39.

To correct this imbalance, the average wage would have to rise 155%, from $31.08 to $79.25. This is the cold, hard maths of our situation: the average wage would have to be almost $80 to give the average Kiwi worker the same chance of owning the average home as in 1992.

Note that an average wage of $79.25 an hour would represent no change in wealth from 1992. Even with an average wage that high, we would still have no more average-house-buying power than the average wage did in 1992. All of the benefits of the last 26 years of technological and logistical advances would go to their creators and the capital that financed them.

$79.25 is what the average Kiwi worker would have to make per hour today, in order to have the same average-house-buying power as they would have had in 1992. If the average worker got a share of that, the average wage would be over $100 per hour.

Note also that it’s much harder to get a job paying the average wage at age 21 now, compared to 1992. A Bachelor’s degree is no longer the mark of excellence that it was in the mid 1990s – now one needs a Master’s degree to be at that level, which means two more years of no earnings and borrowed money. Moreover, the open borders of neoliberalism mean that you now have to compete with half of the planet just to get that one job.

Note thirdly that $560,000 is the average New Zealand price and is no way representative of Auckland or even Christchurch or Wellington. If you want to buy an average house in a relatively major centre you will be looking at paying even more than $560,000.

In summary, the Baby Boomers of New Zealand have subjected Generation X and the Millenials to what can only be described as intergenerational rape.

*

If you enjoyed reading this essay, you can get a compilation of the Best VJMP Essays and Articles of 2017 from Amazon for Kindle or Amazon for CreateSpace (for international readers), or TradeMe (for Kiwis).

Cricket Is More of a Global Sport Than Soccer Is

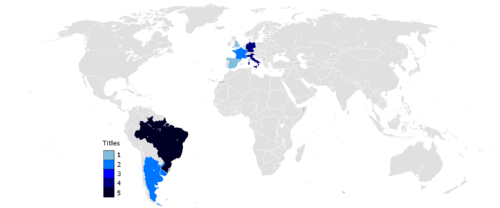
Geographical spread of Soccer World Cup winners

Another Soccer World Cup, another champion from Europe. Everyone is waxing lyrical at the moment about how wonderful the Soccer World Cup is, and how it bring all nations together in harmony with a common goal. The truth, as this essay will demonstrate, is that cricket is more of a global sport than soccer by at least three major measures.

Geographic representation

As can be seen by the quarterfinalists of the recently concluded Soccer World Cup, soccer is still very much a European sport. Six of the eight quarterfinalists came from this one continent that contains less than 10% of the world’s population.

Over the last three FIFA World Cups, 23 of the 24 quarterfinalists have come from either Europe or Latin America. The single exception was Ghana, back in 2010. So only two continents are ever really represented by the finalists in Soccer World Cups. Asia, Africa, Anglo America, Australia and Oceania don’t feature – a group of countries that includes the world’s five most populous.

For the most part, only Europeans and South Americans really play soccer, but they are capable of getting an extremely high level of performance out of Africans that have been integrated into European structures. Sufficient evidence for this comes from the fact that France won the 2018 World Cup just now.

Since World War Two, only one team from outside Europe and Latin America has ever made a Soccer World Cup semifinal: South Korea in 2002, and they only advanced that far thanks to some extremely questionable refereeing decisions. Every single other semifinalist has been from one of two continents. This is hardly befitting of “the world sport”.

The Cricket World Cup, by contrast, brings the entire world together. The last Cricket World Cup, in 2015, featured teams from four different continents at the semifinal stage: Asia, Africa, Australia and Oceania. Teams from North America and Europe have previously contested finals, meaning the overall reach of the sport is greater than that of soccer.

Population

Some people object to the statement made in the first section of this essay. Although most are willing to concede that the geographical representation of soccer is not great, many will nevertheless insist that Europe is a great population centre and therefore can’t merely be counted as one continent. This may have been true a century ago, but no longer is.

The population of Europe is 741,000,000. The population of Latin America is 640,000,000. This means that virtually all of the Soccer World Cup quarterfinalists throughout history come from a bloc of 1,381,000,000 people, roughly 20% of the world’s population.

The remaining 80% of the world’s population – comprising China, India, Africa, Indonesia and Pakistan – essentially never get representation among the final eight teams of Soccer World Cups. India and Pakistan have both won Cricket World Cups, by contrast, and are perennial quarterfinalists along with Bangladesh, South Africa and Sri Lanka.

The population of India, where cricket is the only game in town, is 1,325,000,000, essentially the same as the combined populations of Europe and Latin America. This is a fact that needs repeating for those who think that soccer is the global game: the combined populations of the only places capable of competing at the top level of soccer only just equals the population of India alone.

Measuring population properly requires that we add, to the cricket-fanatic side of the ledger, Pakistan (pop. 208,000,000), Bangladesh (pop. 163,000,000), Sri Lanka and Australia (c. 60,000,000), plus several million others in England, South Africa, New Zealand, Ireland and the West Indies, where cricket might not be the national sport but is still one of the major ones.

Against this, soccer has much less overall market share in the countries in which it is popular than cricket does. In Europe and Latin America, soccer has to compete with volleyball, basketball, tennis, handball and golf; in India, Pakistan, Bangladesh, Sri Lanka and Afghanistan, cricket is completely dominant. Therefore, it must have more total fans in the world than soccer does.

Appeal within nations

Possibly the most crucial of the three difference between the sports is this one. Soccer mostly appeals to a lower socioeconomic demographic, for who the sport is an escape from the drudgery of everyday life, akin to a circus. Cricket, by contrast, appeals to a higher socioeconomic demographic, for who the sport is the complete test of mental and physical strength and skill and more akin to improvisational theatre.

Soccer players are frequently crude, brutal, thuggish. They cheat so shamelessly that many consider it part of the game. Cricket is a sharp contrast. Men like Rahul Dravid, Ross Taylor and AB de Villiers are complete gentlemen: gracious in victory and defeat, magnanimous, charismatic, serene. Former Indian captain Mahendra Singh Dhoni is literally a prince. He is the upper class of the upper class, an aristocrat by any measure.

If any doubt remains that soccer fans are inherently more base than cricket fans, simply examine the writings of former cricketers like Martin Crowe and Kumar Sangakkara on CricInfo. There is no soccer equivalent.

What soccer is – and this is the cornerstone of its apparent popularity – is the McDonald’s of world sports. It’s a corporatised appeal to the dopamine-deprived brains of society’s lowest common denominator, which is all it can really be on account of its simplistic and luck-based nature. Soccer fans like to tout the ease of understanding the sport as one of its drawcards, but it reality this simply makes it boring to anyone with an IQ over 110 or so.

Over a billion people watched the final of the 2018 FIFA World Cup, according to FIFA themselves. However, more people saw the India vs. Pakistan match during the 2015 Cricket World Cup. The world record for concurrent viewers to a live-streaming platform was set at 10,700,000 earlier this year, not by the final of a European soccer league but by the Indian Premier League of T20 cricket.

What does it mean that more people watch a group match in the Cricket World Cup than the final of the hypefest that is the Soccer World Cup? What does it mean that more people watch the final of an Indian cricket league than the final of any European soccer league? It can only mean that cricket appeals to more human beings than soccer does.

In summary, the delusion that soccer is the “global game”, simply because it’s played in Europe, Latin America and Africa, has to end. Europe is now less than 10% of the world’s population, barely more than half of the population of India alone. If those Indians are to be considered people of equal value to the Europeans, it must be conceded that their passions are of equal value. If so, cricket is a more passionately-followed sport than soccer, measured on a global basis.

*

If you enjoyed reading this essay, you can get a compilation of the Best VJMP Essays and Articles of 2017 from Amazon for Kindle or Amazon for CreateSpace (for international readers), or TradeMe (for Kiwis).

The Northcote By-Election Result is Fraudulent and Illegitimate

Northcote by-election candidate Dan Bidois was crowned the winner, despite only getting the support of 21% of eligible voters

The reason why our ruling class have the right to rule, so they claim, is because they have the consent of the masses. But the winner of yesterday’s Northcote by-election and newly crowned Member of Parliament, Dan Bidois, did not have the consent of the masses. Therefore, the Northcote by-election result is fraudulent and illegitimate.

19,900 people cast a vote in the Northcote by-election. According to the Northcote Electoral Profile on the Parliamentary Profiles page, there are 49,569 eligible voters in that electorate. This tells us that barely more than 40% of eligible voters chose to participate in the democratic process – something like 30,000 people abstained.

The question then has to be asked: how is the election of Bidois to the House of Representatives legitimate, when fewer than half of eligible voters took part in the election process? If so few people believed that the democratic process was worth participating in, isn’t that sufficient evidence that it has failed, that its claims of legitimacy are fraudulent?

Bidois himself won 10,147 votes in the by-election, which amounts to almost 21% of the eligible voters in Northcote. If no-one cares about the election, how can the winner of it legitimately claim to have any power to rule anyone? Any reasonable person can see that this is absurd. We can’t possibly know what the electorate wants unless we canvas the non-voters.

One candidate, Liam Walsh of Not A Party, ran specifically on the non-vote. His platform was that democracy has failed and is inherently corrupt (hard to deny) and that it would be better for us to scrap it entirely and work together instead of using the democratic system to try and fuck each other over.

After all, as a National MP, Dan Bidois will immediately work towards the further enslavement of the young, the Maori and the working class. Walsh notes that Bidois came second to an empty seat.

One wonders what would happen if those 60% of adults in Northcote who do not feel represented by New Zealand’s peculiar imitation of democracy gave their allegiance to Walsh instead of to the central government.

What if, instead of paying taxes to the IRD to piss up the wall on flag referendums, yacht races, imprisoning medicinal cannabis growers and importing Somali rapists, people paid no taxes, and we had neither flag referendums nor a justice system putting people in cages for growing medicinal plants?

Some might respond that having no democratic government will leave the community unable to solve problems that require collective solutions, but Dan Bidois, with his 21% support, sure as fuck isn’t going to be solving them either. He, like the majority of backbenchers, will stick his nose straight up the arsehole of his party’s leader, in this case Simon Bridges, and he will keep it wedged there as long as the National Party hierarchy is responsible for his meal ticket. As a consequence he will vote to enforce National Party policy and dogma – not the will of the Northcote electorate.

A democratic election that gets 40% turnout cannot claim to return a legitimate ruler. The vast majority of the Northcote electorate did not consent to being represented by Bidois; therefore, his being in the House of Representatives is no more legitimate than it would have been if the CIA had helped him raise an army that seized power through force.

After all, a foreign-backed dictatorship might even gain the consent of more than 21% of the population – assuming it put a sufficiently enlightened person on the throne – which would make it no less legitimate than yesterday’s by-election.

If the democratic process is rejected by a majority of the people, then it’s time to get together and to think up a new political philosophy that adequately represents them. It’s apparent from the fact that New Zealand clings to cannabis prohibition, a policy supported by almost no-one, that the will of the people is not represented by the law enacted by their rulers. This failure to represent the people’s will is evidence that democracy has failed and needs to be superceded.

*

If you enjoyed reading this essay, you can get a compilation of the Best VJMP Essays and Articles of 2017 from Amazon for Kindle or Amazon for CreateSpace (for international readers), or TradeMe (for Kiwis).