Receiving income from interest, dividends, rent, other investments
0.825
Voting ACT 2020
0.807
Level 6 diploma
0.734
Voting National 2020
0.692
Receiving income from self-employment or owning one’s own business
0.682
Own or part own house
0.679
Aged 55-59
0.674
Aged 60-64
0.655
Aged 75-79
0.654
Aged 70-74
0.653
Aged 85+
0.647
Aged 65-69
0.641
Aged 80-84
0.639
Receiving income from NZ Super or Veteran’s pension
0.636
Aged 50-54
0.630
Voting The Opportunities Party 2020
0.625
Own house in family trust
0.623
Not studying
0.587
Currently partnered
0.572
Working as a manager
0.562
Two children
0.560
Aged 45-49
0.541
Voting Sustainable NZ 2020
0.529
Voting New Conservative 2020
0.524
Employed part-time
0.523
Married (not separated)
0.493
Following no religion
0.482
Personal income $70,000+
0.453
Mean age
0.441
Honours degree
0.419
Doctorate
0.416
Median age
0.404
Voting Greens 2020
0.385
Special voting Yes for euthanasia
0.366
Voting Social Credit 2020
0.338
Three children
0.337
Following Spiritualism or a New Age religion
0.326
Mean personal income
0.305
Divorced/separated/widowed
0.304
Working as a professional
0.296
Personal income $50,000-$70,000
0.282
Voting NZ Outdoors Party 2020
0.277
Voting Labour 2020
0.275
Master’s degree
0.270
Aged 40-44
0.265
Median personal income
0.261
Percentage of voting age population enrolled
0.259
Working in rental, hiring or real estate services
0.250
Working in professional, scientific or technical services
0.246
Following Judaism
0.222
Working in agriculture, forestry or fishing
0.202
Bachelor’s degree
0.197
Working in arts or recreation services
0.194
Working in other services
0.192
Personal income $20,000-$30,000
0.162
Working in public administration or safety
0.156
Working in mining
0.138
Working in healthcare or social assistance
0.117
Voting New Zealand First 2020
0.101
Employed full-time
0.097
Working in financial or insurance services
0.088
Voting Heartland NZ 2020
0.061
Working in accommodation or food services
0.054
Percentage of females in electorate
0.044
Working in retail trade
0.039
Percentage of electorate overseas-born
0.032
Working in education or training
0.030
Working in information media or telecommunications
0.028
Working as a technician or trades worker
0.014
Level 1 certificate
0.010
Not in the labour force
0.006
No children
-0.026
Voting ONE Party 2020
-0.032
Percentage of electorate New Zealand-born
-0.032
Working in construction
-0.035
Percentage of males in electorate
-0.044
Aged 35-39
-0.069
Part time study
-0.080
Living in an urban electorate
-0.093
Working in electricity, gas, water or waste services
-0.094
Level 2 certificate
-0.095
Level 4 certificate
-0.099
Following Buddhism
-0.100
Receiving income from ACC or private work insurance
-0.126
Working as a clerical or administrative worker
-0.139
Aged 30-34
-0.154
Voting Advance NZ 2020
-0.161
Special voting Yes for cannabis
-0.169
Receiving wage or salary
-0.187
Personal income $30,000-$50,000
-0.188
Asian
-0.198
Following Christianity
-0.198
Four children
-0.213
Receiving income from Student Allowance
-0.215
Aged 25-29
-0.231
Personal income $10,000-$20,000
-0.234
Voting TEA Party 2020
-0.238
Level 5 diploma
-0.252
Aged 20-24
-0.259
Following Hinduism
-0.290
Working in wholesale trade
-0.295
Working as a labourer
-0.299
No NZQA qualifications
-0.301
Following Islam
-0.320
Living in a North Island electorate
-0.326
Working as a community or personal services worker
-0.326
Working as a sales worker
-0.352
One child
-0.385
Receiving income from Supported Living Payment
-0.386
Working in manufacturing
-0.404
Personal income $5,000-$10,000
-0.432
Level 3 certificate
-0.487
Voting ALCP 2020
-0.524
Never married
-0.538
Currently unpartnered
-0.572
Five children
-0.580
Object to answering how many children
-0.590
Full time study
-0.611
Working as a machinery operator or driver
-0.614
Following a Maori religion
-0.620
Pacific Islander
-0.628
Working in administrative or support services
-0.664
Maori
-0.666
Voting Vision NZ Party 2020
-0.677
Receiving no source of income
-0.688
Enrolled in a Maori electorate
-0.690
Voting Maori Party 2020
-0.690
Working in transport, postal or warehousing
-0.692
Personal income < $5,000
-0.701
Six or more children
-0.739
Receiving income from Jobseeker Support
-0.744
Receiving income from Sole Parent Support
-0.771
Unemployed
-0.774
Neither ownership of house nor house in family trust
-0.786
*
This article is an excerpt from the upcoming 3rd Edition of Understanding New Zealand, by Dan McGlashan and published by VJM Publishing. Understanding New Zealand is the comprehensive guide to the demographics and voting patterns of the New Zealand people.
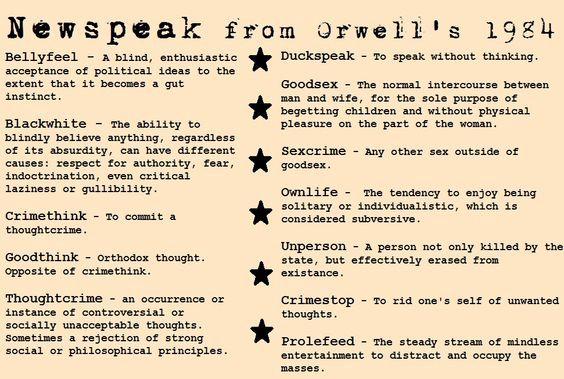
In 1984, the purpose of Newspeak was to make anti-government thoughts impossible. The logic was that if people were prevented by language from talking about opposing the government, they’d also be prevented from thinking about it. Being unable to think about opposing the government, they’d make perfect slaves.
In the West of 2023, our rulers have forced a form of Newspeak on us. As in 1984, the purpose of it is to make dissent impossible. The major difference is that, in our world, Newspeak works by confusing and corrupting existing definitions of words. This has the effect of making communication impossible, and thereby making resistance impossible.
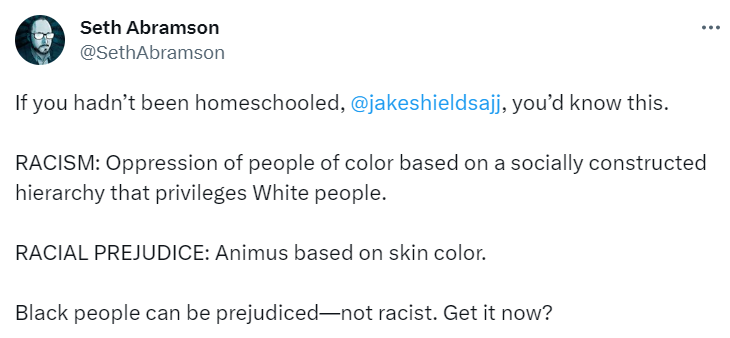
The word ‘racist’ is the classic example of twisted definitions. The word used to refer to people with racial prejudice, who expressed contempt for others for no other reason than their race. But over time, as people displayed a willingness to submit to those shrieking racist, the definition expanded. Today some will argue that the term can only refer to white people.
Ther term ‘racist’ is now so overused that you can be called racist for resisting racism, such as if you say ‘It’s Okay To Be White’. ‘It’s Okay To Be White’ is an explicitly anti-racist statement, used primarily by working-class whites in response to comments such as that of Marama Davidson. That it can be considered racist shows that words (and phrases) can be twisted to their exact opposites in the Newspeak of 2023.
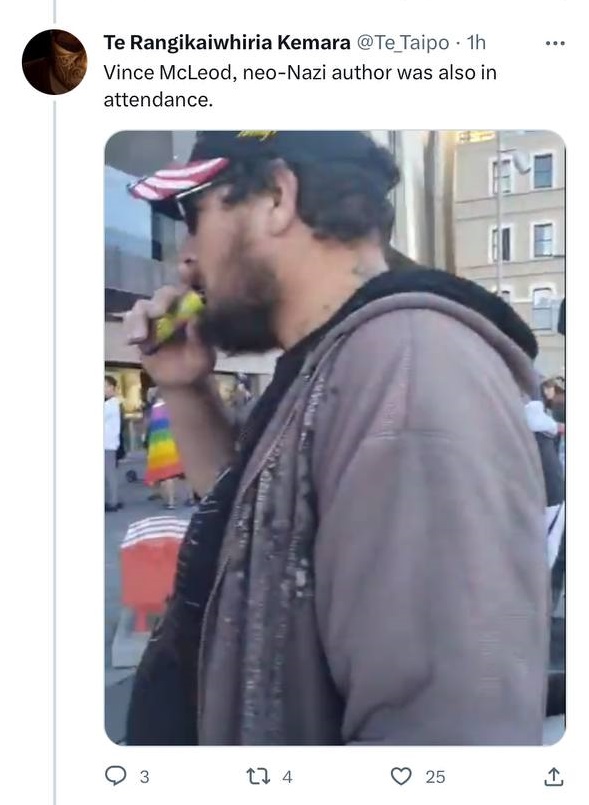
‘Nazi’ is a related example. Originally used to refer to members of the German NSDAP of 1920-1945, it’s now so overused that any nationalist or anti-globalist sentiments are written off as Nazi ones. Today, almost any unfashionable opinion attracts cries of Nazism.
As with racist, a person can explicitly decry Nazism, to the extent of listing multiple grievances with the doctrine, and still get accused of being a Nazi. Trying to distinguish between the nationalist aspects of Nazism and the totalitarian aspects is not permitted. To do so is to become a “Nazi apologist”.
‘Far right’ relates to the above examples. Logically, if the right-wing is capitalist then the far-right ought to refer to hypercapitalist neoliberals like the ACT Party. Bizzarely, however, those described as far-right today are primarily working-class nationalists, whose main complaint is often the corporate importation of cheap labour. Somehow the right-wing are corporates while the far-right is anti-corporate.
‘Nation’ no longer means a population united by ties of blood and soil, as it has always meant. In the Newspeak of 2023, national ties are just like masks that a person puts on and takes off as needed. Anyone can claim to be of any nationality. The dumbing-down of language has obscured the difference between roots citizens and paper citizens. All are considered part of one big club, defined not by Nature but by the Government.
‘Disinformation’ now means ‘anything said by someone the Government doesn’t like’. This has been made evident by the New Zealand Government’s Disinformation Project, which serves as a Ministry of Truth, smearing anyone who speaks out against the ruling class. Enemies of the Government, in Newspeak, are incapable of speaking the truth. Everything they say is either disinformation, misinformation or malinformation.
‘The economy’ now means ‘the interests of international banking and finance’. It doesn’t have anything to do with the material needs of the nation being met. Today’s Newspeak will claim that the economy is doing well because unemployment is low, and will ignore the fact that most of those jobs don’t pay enough for the workers to own homes and raise families.
It doesn’t matter if people can raise families, because, as per the Newspeak definition of nation, the nation doesn’t need families. It can just import them from overseas, and as long as the GDP goes up it’s all good. Herein it can be seen that the Newspeak of 2023 is a form of neoliberal totalitarianism, unlike the national socialist and communist forms of totalitarianism in surface ways, but like them in fundamental ways.
‘Conspiracy theorist’, heard often in the mainstream media of 2023, is classic Newspeak. It’s another term for wrongthinker, denoting someone who is outside of society, a memetic outlaw. Even though human history is a parade of conspiracies, one after the other, anyone who notices a conspiracy in 2023 is equated with the severely mentally ill. ‘Conspiracy theorist’, in 2023 speak, is a synonymn for ‘schizophrenic’, i.e. a person whose paranoia leads them to see things that aren’t there.
There’s a reason why Confucius said that, if he were to be offered power, the first thing he would do would be the “rectification of names” i.e. he would make sure that words had accurate, commonly-understood meanings again. Newspeak was a thing in ancient China just as it was in 1984, and just as it is in 2023. Wherever you have totalitarianism, you have centralised attempts to control expression.
“In the end we shall make thought-crime literally impossible, because there will be no words in which to express it,” Orwell wrote. In 2023 thoughtcrime has been made impossible by the fact that each of us has been trapped in a silo of language, where communication is crippled by an absence of common understanding of the words we are using.
The Newspeak of 2023 has twisted all language, not to the service of Big Brother, but to globohomo – the alliance of globalist capitalism and globalist communism that has forced neoliberalism on the populations of the West. It’s no longer a sure thing that, when a person uses a particular word, that their audience will understand the intended meaning of that word. And so, we’re too confused to resist our ruling classes.
The final chapter of this book answers the question of which demographics turned out to vote in the 2020 General Election. In total, 2,919,073 people cast a party vote, out of 3,549,580 eligible voters, for a turnout rate of 82.24%. This was higher than in 2017, breaking the usual trend of declining turnout rates in Western democracies.
Turnout rate is very closely related to general disenfranchisement, hence the General Disenfranchisement Rule. As we can see in the analysis below, it’s possible to tell who is running society from the extent of their engagement in the political system. The higher the turnout rate, the higher the engagement, the more power and influence.
Variable
Turnout rate 2020
Voting Labour 2020
0.28
Voting National 2020
0.69
Voting Greens 2020
0.39
Voting ACT 2020
0.81
Voting New Zealand First 2020
0.10
Voting New Conservative 2020
0.52
Voting The Opportunities Party 2020
0.63
Voting The Maori Party 2020
-0.69
Voting Advance NZ 2020
-0.16
Voting Sustainable NZ 2020
0.53
Voting ALCP 2020
-0.52
Voting TEA Party 2020
-0.24
Voting Heartland NZ 2020
0.06
Voting Social Credit 2020
0.34
Voting NZ Outdoors Party 2020
0.28
Voting ONE Party 2020
-0.03
Voting Vision NZ 2020
-0.68
Perhaps more than any other measure, the correlations between party affiliation and turnout rate reveal who the true ruling class of New Zealand is. Those who turn out to vote are those psychologically engaged with the political system. They are those with a reasonable expectation that a politician might listen to them.
The top tier by this measure are ACT, National and The Opportunities Party. The correlation between turnout rate in 2020 and voting ACT in 2020 was 0.81; with voting National in 2020 it was 0.69; with voting The Opportunities Party in 2020 it was 0.63. These voters comprise society’s insiders – the wealthy and influential. They are the people who are in charge almost no matter what the political system is.
Immediately underneath them are New Conservative, Greens and Labour voters. The correlation between turnout rate in 2020 and voting New Conservative in 2020 was 0.52; with voting Greens in 2020 it was 0.39; with voting Labour in 2020 it was 0.28.
New Conservative voters are old and old people have very high turnout rates (see below). Greens voters are young but are usually from wealthy families and are usually well-educated. The significant positive correlation between turnout rate in 2020 and voting Labour in 2020 is harder to explain. In truth, Labour voters are part of the political Establishment.
The three parties whose supporters were least likely to turn out to vote were the Maori Party, Vision NZ and the ALCP. The correlation between turnout rate in 2020 and voting Maori Party in 2020 was -0.69; with voting Vision NZ it was -0.68 and with voting ALCP it was -0.52. It’s not news that Maori people tend to be disenfranchised, and all three of these parties have a high proportion of Maori voters.
Variable
Turnout rate in 2020
No NZQA qualifications
-0.30
Level 1 certificate
0.01
Level 2 certificate
-0.10
Level 3 certificate
-0.49
Level 4 certificate
-0.10
Level 5 diploma
-0.25
Level 6 diploma
0.73
Bachelor’s degree
0.20
Honours degree
0.42
Master’s degree
0.27
Doctorate
0.42
It’s well understood that the more educated someone is, the more enfranchised they tend to be. Educated people can express themselves in agreeable and persuasive ways, and tend to be more influential thereby. People with university degrees are heavily over-represented in Parliament, even among Labour Party MPs.
Therefore, it’s not surprising to see significant positive correlations between having any of the postgraduate university degrees and turnout rate in 2020.
It might be surprising to see that the correlation between having a Bachelor’s degree and turnout rate in 2020, while positive, was not significant. After all, a large proportion of the managerial class have that qualification. But the explanation is simple: most people with degrees are young, and young people tend not to vote (see below).
There was a significant negative correlation between turnout rate in 2020 and having no NZQA qualifications (-0.30). Many would have expected this to be stronger, but people in the older age groups are much more likely to have no NZQA qualifications than people in the younger age groups, balancing out the fact that older age groups are more likely to vote.
Variable
Turnout rate in 2020
Aged 20-24
-0.26
Aged 25-29
-0.23
Aged 30-34
-0.15
Aged 35-39
-0.07
Aged 40-44
0.27
Aged 45-49
0.54
Aged 50-54
0.63
Aged 55-59
0.67
Aged 60-64
0.65
Aged 65-69
0.64
Aged 70-74
0.65
Aged 75-79
0.65
Aged 80-84
0.64
Aged 85+
0.65
The origin of the widespread dislike of Boomers can be noted in the table above. Old people are far more likely to turn out than younger ones. Even taking into account the fact that people under 18 can’t vote, old people are much more likely to vote in New Zealand than younger ones.
There was a negative correlation between turnout rate in 2020 and being in any age group under 40 years old. This shows that New Zealand is little different to other modern democracies when measured by the turnout rate of young people.
There was a strong positive correlation (0.63 or stronger) between turnout rate in 2020 and being in any age group above 50 years old. The over-50s hit the polling booths in massive proportions. If the General Disenfranchisement Rule shows us anything, it’s that Boomers are enfranchised.
The age group between 40 and 50 appears to be when, in New Zealand, the transition from liberal to conservative is made. This is also when the transition from renter/mortgage holder to homeowner is usually made. These two apparent facts are intimately related. Not until most people become homeowners themselves do they feel an interest in conserving the status quo.
Variable
Turnout rate in 2020
Percentage of males
-0.04
Contrary to the expectations of some – but which could be surmised by many – there is no statistical evidence that men are more enfranchised than women. Although the historical example has been one of male dominance, there is little evidence that this state of affairs exists in the present day. Indeed, the correlation between turnout rate in 2020 and being male was negative (if too weak to be significant).
This could be guessed by anyone who knew that the correlations between being male and holding any of the university degrees were all negative. However true the historical example of male dominance might be, the experience of today is closer to the opposite.
Variable
Turnout rate in 2020
Being European
0.83
Being Maori
-0.67
Being Pacific Islander
-0.63
Being Asian
-0.20
Anyone who thinks that white Kiwis and Maori Kiwis are roughly equally enfranchised would get a shock from looking at the statistics.
The correlation between turnout rate in 2020 and being of European descent was extremely strongly positive, at 0.83. This is one of the strongest correlations in this entire study, of either direction. The correlation between turnout rate in 2020 and being of Maori descent, by contrast, was strongly negative, at -0.67.
It might be true that Maoris are technically over-represented in Parliament, in that there are more Maori MPs than the Maori proportion of the population would warrant, but that isn’t the same thing as enfranchisement. Enfranchisement is when you can reasonably expect your MP to listen to you and to take your concerns seriously, whatever their race.
Pacific Islanders are about as disenfranchised as Maoris. The correlation between turnout rate in 2020 and being a Pacific Islander was -0.63. This cannot be explained by Pacific Islanders being outside the bicultural system, because the correlation between turnout rate in 2020 was much less negative, at -0.20. Thus, poor education and low levels of wealth better explain the low Pacific Islander turnout.
Some might argue that Asians vote in high numbers out of a sense of duty, and are not truly enfranchised. That may be true to some extent. Nonetheless, the fact is that if Asians do vote in high proportions, they will have a significant influence on the vote (see the cannabis referendum for an example).
Variable
Turnout rate 2020
Income < $5,000
-0.70
Income $5,000-$10,000
-0.43
Income $10,000-$20,000
-0.23
Income $20,000-$30,000
0.16
Income $30,000-$50,000
-0.19
Income $50,000-$70,000
0.28
Income > $70,000
0.45
The correlations between income groups and turnout rate in 2020 will surprise few. With a few exceptions, these correlations follow the General Disenfranchisement Rule closely, in that the rich tend to vote and the poor tend to not vote.
Voters in every income group below $20,000 had a significant negative correlation with turnout rate in 2020. This is not surprising, as most beneficiaries will be in this category, and beneficiaries comprise a large proportion of society’s most disenfranchised people.
Voters in both income groups above $50,000 had a significant positive correlation with turnout rate in 2020. The strongest was between having an income above $70,000 p.a. and turnout rate in 2020, which was 0.45. It is people in this group who politicians listen to the most.
The general rule is obvious: the wealthier a person is, the more enfranchised they tend to be. This rule is already widely understood, but it’s useful to put some numbers to it.
It might seem paradoxical that the correlation between turnout rate in 2020 and having an income between $20,000 and $30,000 is positive, while the correlation between turnout rate in 2020 and having an income between $30,000 and $50,000 was negative. This is because those receiving between $20,000 and $30,000 tend to be students and pensioners, and therefore not really disenfranchised, whereas those between $30,000 and $50,000 tend to be minimum wage workers or in other working-class occupations, and therefore closer to the bottom of society than either students or pensioners.
Variable
Turnout rate in 2020
Working as a manager
0.56
Working as a professional
0.30
Working as a technician or trades worker
0.01
Working as a community or personal services worker
-0.33
Working as a clerical or administrative worker
-0.14
Working as a sales worker
-0.35
Working as a machinery operator or driver
-0.61
Working as a labourer
-0.30
The two most privileged occupations are the two most enfranchised ones. Both of the correlations between turnout rate in 2020 and working as either a manager (0.56) or as a professional (0.30) were significantly positive. Ultimately it’s managers and professionals who run society, and so it’s them that politicians listen to the most.
People in middle-class jobs had moderate levels of enfranchisement. Neither of the correlations between turnout rate in 2020 and occupation were significant in the case of working as a clerical or administrative worker (-0.14) or working as a technican or trades worker (0.01). The latter correlation might even be more positive than expected, a result of the fact that technicians and trades workers tend to be in the relatively elderly age groups, and those age groups have high turnout rates.
Working-class Kiwis were the most disenfranchised. There was a significant negative correlation between turnout rate in 2020 and working as any of a machinery operator or driver (-0.61), sales worker (-0.35), community or personal services worker (-0.33) or labourer (-0.30). Politicians don’t generally care what people in these occupations think, hence the disenfranchisement.
Variable
Turnout rate in 2020
No source of income
-0.69
Income from wage or salary
-0.19
Income from self-employment or own business
0.68
Income from interest, dividends, rents or other investments
0.83
Income from ACC or private work insurance
-0.13
Income from NZ Super or Veteran’s pension
0.64
Income from Jobseeker Support
-0.74
Income from Sole Parent Support
-0.77
Income from Supported Living Payment
-0.39
Income from Student Allowance
-0.22
The cynical will feel proven correct when they hear that the correlation between turnout rate in 2020 and receiving an income from interest, dividends, rents or other investments was 0.83, one of the strongest correlations in this study. It is people who receive an income in this manner who are the most enfranchised of all.
Also highly enfranchised are people who receive an income from self-employment or one’s own business, and people who receive an income from NZ Super or Veteran’s pension. The correlation between turnout rate in 2020 and the former was 0.68, and with the latter it was 0.64.
These three groups of income recipients are the people that politicians listen to the most. A high proportion of them work as managers, whether hired or inheritors.
Perhaps dishearteningly, there was a negative (if not significant) correlation between turnout rate in 2020 and receiving an income from a wage or salary: -0.19. This suggests that the people who do most of the work in our society, whose efforts keep it running, are disenfranchised, nearly significantly so.
The most disenfranchised Kiwis are those on unemployment, sickness or invalid’s benefits. These are society’s forgotten, who have the lowest status and who politicians listen to the least. The correlation between turnout rate in 2020 and receiving income from Jobseeker Support was -0.74, and between turnout rate in 2020 and receiving income from Sole Parent Support was -0.77.
The correlation between turnout rate in 2020 and receiving income from a Student Allowance was negative, but not significantly so (-0.22). Again, this is because students occupy an usual place in the class hierarchy: disenfranchised by age, enfranchised by class. As such, their turnout rate was higher than the other non-pensioner beneficiaries.
Variable
Turnout rate in 2020
Has no religion
0.48
Is a Buddhist
-0.10
Is a Christian
-0.20
Is a follower of the Maori religions
-0.62
Is a Hindu
-0.29
Is a Jew
0.22
Is a Muslim
-0.32
Is a Spiritualist or New Ager
0.33
That New Zealand is a materialist society is shown by many things, and the correlations between turnout rate in 2020 and following a religion is another of those things. The religious affiliation that had the strongest positive correlation with turnout rate in 2020 was having no religion (0.48). This will surprise many who think of atheists as degenerate outsiders. In fact, the people running this society tend to have no religion.
There was a strong negative correlation between following one of the Maori religions and turnout rate in 2020 (-0.62). This is no doubt a function of the significant negative correlation between being Maori and turnout rate in 2020.
Weaker, although still negative, correlations were found between turnout rate in 2020 and being a Muslim (-0.32), a Hindu (-0.29), a Christian (-0.20) or a Buddhist (-0.10). The correlation with Christianity will surprise many, as it is generally assumed that Christians comprise a large part of the power structure in New Zealand. Although this is true, a high proportion of practicising Christians in New Zealand are relatively disenfranchised Pacific Islanders.
Variable
Turnout rate in 2020
No children
-0.03
One child
-0.38
Two children
0.56
Three children
0.34
Four children
-0.21
Five children
-0.58
Six or more children
-0.74
Another nonlinear set of correlations are those between turnout rate in 2020 and number of children.
Some might expect that, since people with no religion have a high turnout rate, and since people with no religion often have no children, that people with no children must have a high turnout rate. This is not the case. The correlation between turnout rate in 2020 and having no children was -0.03.
The strongest positive correlation between turnout rate in 2020 and having any number of children was with two children (0.54), followed by three children (0.34). These correlations represent modal families, in the sense that most upper-middle-class families will have two or three children.
There was a negative correlation between turnout rate in 2020 and any of having four children (-0.21), five children (-0.58) or six or more children (-0.74). This reveals that two is the normal number of children to have, and that a person becomes more disenfranchised the more children they have beyond two.
Variable
Turnout rate in 2020
Own or part own house
0.68
Own house in family trust
0.62
Neither outright ownership of house nor house in family trust
-0.79
One of the main reasons why housing is a major issue in most Western countries right now is that it relates to the feeling of being part of society. For many people, if they don’t own a house they don’t feel like they have a stake in society, and those who don’t feel like they have a stake in society tend to not bother voting.
Reflecting this is the extremely strong negative correlation between turnout rate in 2020 and neither owning a house nor owning a house in a family trust. This was -0.79, showing that non-houseowners are one of New Zealand society’s most disenfranchised groups, despite also being a very large one.
The correlation between turnout rate in 2020 and owning or part-owning a house, by contrast, was 0.68. This is very strong, and shows that homeowners definitely consider themselves listened-to by the political establishment.
In summary, the turnout rates among the various demographics in the 2020 General Election reflect the extent to which those various demographics are enfranchised by the political establishment. ACT/National-voting, old, educated, atheist, white, homeowning managers and professionals of either gender are those primarily enfranchised by the current order, and Maori Party/ALCP-voting, young, poorly-educated, Maori and Pacific Islander, renter labourers and beneficiaries are those primarily disenfranchised.
*
This article is an excerpt from the upcoming 3rd Edition of Understanding New Zealand, by Dan McGlashan and published by VJM Publishing. Understanding New Zealand is the comprehensive guide to the demographics and voting patterns of the New Zealand people.
The phrase “God of the gaps” is used to mock a particular kind of religious fundamentalist – the type who leaps on every gap in scientific explanation of natural phenomena, and declares it proof of God’s existence. Were the gap not proof of God’s existence, so the argument goes, then the materialist scientist ought to be able to explain it.
Thus, phenomena like the existence of the cosmos, the origin of life, the cause of diversity in animals and plants and the existence of consciousness are regularly attributed to the workings of God. If a scientist can’t explain them, then Goddidit.
The mockery is motivated by the fact that fanatics view the entire world through the lens of their obsession, and so they find that obsession everywhere, in every nook and cranny of reality. Hence, the religious fanatic sees their god hiding in every gap of the natural world, which seems ridiculous to others.
Today, in the Clown World of 2023, those who want to get a big dopamine hit from feeling morally superior to other people don’t use God. They use race. No-one cares about God any more. But race is everywhere and everything in the multicultural West. It’s rare now to find one street, one workplace or one television show without prominent virtue-signalling.
As such, there now exists a phenomenon that can be referred to as “the racism of the gaps”. This is when differences in outcome between any two human populations is ascribed to racism before any other explanation is considered, or when more plausible but non-race-based explanations are rejected. If a person from Race A has any kind of advantage over, or better outcome than, a person from Race B, then the gap is best explained by racism.
The most common example of the racism of the gaps fallacy relates to the so-called “wage gap”. The logic is that non-whites earn less money than whites because institutional racism discriminates against non-whites. This racism means that non-whites are passed over for promotions, or not hired in the first place, thereby giving them fewer opportunities to make money.
Blank slate logic only holds if a person believes that all human populations are precisely the same in all intellectual measures. The simple fact that most Asian groups in the West do as well, or better than, white people, despite suffering as much, or more, prejudice than much less successful immigrant groups, is sufficient evidence to disprove blank slate theory.
Moreover, the psychological literature clearly states that the most important factor determining the income of any individual or group is IQ, and the measured IQs of all the various races in the West correlate strongly with their economic outcomes. If the various races are as wealthy as the science predicts they should be, what’s the problem?
The term ‘racism of the gaps’ mocks the fact that no social justice warrior has ever been able to quantify the effect that all the supposed white supremacy has had on the beleaguered non-whites of the world. All the science explaining the differences between races is thrown out the window in preference of a Cultural Marxist narrative about racism – it’s right to mock such low-IQ thought processes.
Racism of the gaps also appears when people ask, for example, why there are so few Maoris or Pacific Islanders in the New Zealand cricket team. The implication is that some nefarious white conspiracy is preventing them from accessing opportunities. The reality, of course, is that Maoris and Pacific Islanders prefer to play other sports.
No-one makes the claim that the NRL is racist in favour of Maoris and Pacific Islanders because they are heavily over-represented in rugby league. The people pushing the racism of the gaps fallacy only care about something if there’s a racial angle that can be exploited, especially an anti-white one.
Much like the term ‘racism’ itself, ‘racism of the gaps’ refers to a deliberate strategy to undermine Western society by setting different racial groups against each other. It’s pushed by the ruling class, particularly the globalist ruling class, who want all the peoples they rule over divided and conquered along every possible fracture line. Thus they claim racism where it doesn’t exist, in order to stoke tensions and mistrust.
The best way to stop this pernicious logic from becoming even more widespread is to mock it at every turn. Any time someone leaps to blame racism for some difference in outcome, on flimsy and unscientific evidence, laugh at them for committing the racism of the gaps fallacy. Make them feel stupid for pushing long-debunked blank slate nonsense.