Cannabis and Alcohol Users Must Unite Against the Wowsers and Control Freaks

Some Kiwis might have woken up from a New Year’s-induced stupor long enough to ask: “What happened to the Wellington Sevens?” Well, sit down, folks – I’ve got a bitter and tragic tale to tell.

The short of it, though, is this – New Zealand is full of wowsers, and those wowsers saw Kiwis having a good time and decided that this had to be stomped down as soon as possible, lest anyone get carried away.

The linked article notes that the occasion was essentially “a two day party with a bit of sevens rugby on the side” and it died because “the organisers have slowly strangled the event with tighter and tighter regulations as the years went by.”

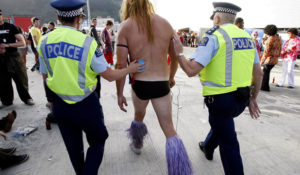
Amazingly, putting several tens of thousands of drunks in a confined space in the middle of summer didn’t end without problems.

But, as this essay will argue, so what?

14 years of what had grown to become the single greatest annual festival in the Kiwi cultural calendar, was destroyed by the Fun Police in a couple of years: “the wowsers have killed off the atmosphere that made the Wellington Sevens so popular.”

This year, an event that used to sell out a 30,000+ seat stadium in minutes has struggled to sell so much as 1,300 tickets. The general attitude towards the event from once-loyal partygoers is that “they can’t have fun at the event in case they upset someone.

The question is: why do we let them do this to us?

So what if a few drunks caused trouble and created a sub-optimally family-friendly atmosphere. So what? Do we live in a McDonald’s playground?

It’s time to stop the rout! Everyone who enjoys drinking alcohol has to face up to this fact – cannabis is already illegal and tobacco is being made illegal. What’s going to stop the control freaks from cracking down on alcohol once they’ve banned tobacco?

And will Kiwis do anything it when it happens, or just take it up the arse as we have done thus far?

Is it acceptable that it is gradually becoming illegal to have fun? Are we doomed to end up like the Soviet Union, streets full of dour, grey-faced citizens conditioned to be afraid to crack a joke or a smile, lest they fall foul of some bureaucratic juggernaut that comes after them like a pitbull?

New Zealand has to face the very real possibility that, as our population continues to age, we will eventually ban every possible avenue of enjoyment and turn the whole country into a giant old folks’ home.

Pissheads and potheads, its time to acknowledge that we have a mutual enemy that is only growing in power as the population ages and our politicians become ever more out of touch with reality.

This enemy has existed all throughout history, and it waxes and wanes in strength according to the fashions of the age. It’s an enemy that resents all fun, resents all happiness, and which resents life itself.

The New Zealand Wowser is the single greatest threat to our quality of life. If we do not begin to oppose them, we will wake up one morning to find that everything is illegal except for a curated, Health and Safety-approved set of behaviours on a short list.

Understanding New Zealand: Voting by Industry and Employment Status I

This article looks at what we can tell about the preferred industries of certain voting blocs based on their voting patterns. For the most part, the statistics in this area are fairly predictable, because industry types tend to be class defined and we already know which social classes vote for which parties.

There were few occupations that correlated with a significantly lower vote for the National Party in 2014, which is not surprising considering that National won the election. The most prominent was the transport, postal and warehousing industry, who had a correlation of -0.51 with voting National in 2014. As mentioned above, this can likely be best explained by the fact this is generally a working class industry.

It was a different story with rental, hiring and real estate services, which had a correlation of 0.49 with voting National. This is also not particularly surprising as it is an industry that essentially tries to generate money without performing any labour, i.e. by rent-seeking. Real estate agents and property managers are known for being the types that will do anything for a buck.

For the Labour Party these roles were, unsurprisingly, reversed – the transport, postal and warehousing industry had a correlation of 0.55 with voting for the Labour Party, probably reflecting the fact that if a Kiwi drives for a living they are very likely to be some kind of bogan and therefore a natural Labour voter.

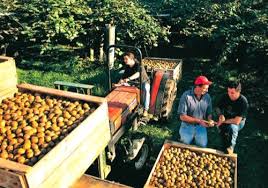
One statistic that will surprise many is the voting pattern of people in the agriculture, forestry and fishing industries. Many would expect people in these primary industries to vote Labour or Green, but it is not the case. These people are more likely than anyone to vote New Zealand First – there is a correlation of 0.40 between being in agriculture, forestry or fishing and voting New Zealand First, compared to -0.31 for Labour and -0.24 for the Greens.

This can be explained to some extent by the fact that people working in agriculture, forestry and fishing are more likely than average to be Maori (the correlation between the two is 0.22), and Maoris are significantly more like to vote New Zealand First.

The interesting thing about that is it shows the people who vote Green seldom actually have anything to do with the environment, because they usually live in wealthy neighbourhoods in big cities.

Green voters are more likely than any others to be students – being on the student allowance has a correlation of 0.55 with voting Green in 2014, compared to 0.34 for Labour, -0.18 for New Zealand First and -0.46 for National. They are also more likely than any other to work in hospitality – voting Green in 2014 had a correlation of 0.52 with working in accommodation.

Green voters are the ones most likely to be involved in the new technological occupations. Even though Green voters are older than Labour ones, voting for them correlates more strongly with high-tech occupations than voting for Labour does. Voting Green in 2014 has a correlation of 0.63 with working in professional, scientific and technical services, and a correlation of 0.70 with working in information media and telecommunications.

The Greens also overwhelmingly dominate the arts and recreational services industry. People working in this industry have a correlation of 0.69 with voting Green in 2014, compared to -0.17 for National voters, -0.13 for Labour voters and -0.18 for New Zealand First voters.

Oddly, there’s a pattern based on benefit type. Pensioners vote National (correlation: 0.50), unemployment beneficiaries vote Labour (0.62), students vote Green (0.55) and invalid’s beneficiaries vote for the Aotearoa Legalise Cannabis Party (0.76).

This latter correlation is both very strong and will be very surprising to many, until one considers that it is precisely invalid’s beneficiaries who suffer the worst from the Government’s refusal to reform our cannabis laws.

*

This article is an excerpt from Understanding New Zealand, by Dan McGlashan, published by VJM Publishing in the winter of 2017.

Is Ross Taylor the Most Underrated Kiwi Sportsman of All Time?

rosstaylor

Last month, the Black Caps cruised to a 2-0 series win against Pakistan in New Zealand, the first series win against the side in over 30 years. The Second Test was notable for involving yet another Ross Taylor century, this one an unbeaten 102 which was also the only century of the series.

Let’s get one thing out of the way first – it’s obvious that the most underrated sportsman in New Zealand could not possibly be a rugby player, and the other sports apart from cricket are either not popular enough for dominance in them to be meaningful (union, league, hockey, netball) or they are sports in which no Kiwis are any good (soccer, volleyball, tennis, golf). So cricket it is.

Taylor, who has been mentored by none other than Martin Crowe, has also taken after Crowe in terms of statistical dependency. Taylor has now played 78 Tests to Crowe’s 77, and the rest of their statistics are also strikingly similar.

Crowe ended his career with a test average of 45.36; Taylor is currently on 46.70. Crowe managed 17 tons in his Test career; Taylor has played one more match for one ton fewer. And both players favoured the No. 4 position – in 106 innings there Crowe averaged 49.39; Taylor has batted 4 on 123 occasions for an average of 49.99.

Their Test strike rates are very different: Taylor has 59.17 compared to Crowe’s 44.65. Taylor has also been part of a generally stronger side – he has enjoyed 23 Test wins compared to Crowe’s 16.

Considering that Martin Crowe has a place in the popular consciousness as New Zealand’s second-best cricketer ever, the fact that Taylor can match him on the numbers is enough to suggest that he belongs, like Crowe, Sir Richard Hadlee, Chris Cairns, Shane Bond and Kane Williamson, in any conversation about the very best.

Moreover, Taylor isn’t finished yet. He has been much more fortunate with injuries than Crowe, and could well end up playing 100 Tests. Since he keeps getting better with age – under Williamson’s captaincy Taylor averages 52.27 in 16 ODIs and 70.75 in 8 Tests – and is not yet 33, Taylor could cement his spot in the pantheon.

Some of what Taylor has already achieved goes well beyond what one might expect of a merely excellent batsman. A handful of selected career highlights:

1. 290 in Australia, the highest ever score by a visiting batsman in Australia in Test history. The craziest thing about this innings is that it didn’t end with a feather to the keeper or to swing, seam, drift, tweak or rip, but with a slog to square leg because that was the match situation. Selfless.

2. 154 not out in Manchester, in a match where England, who scored only 202 in the second innings, still won the match. Coming eight years before the 290 in Perth, this innings helps demonstrate that New Zealand has definitely got their money’s worth out of picking Taylor.

3. Taylor has an ODI average of 43.15, which is higher than all of Ricky Ponting (42.03), Kumar Sangakkara (41.98), Brian Lara (40.48) and Martin Crowe (38.55). What’s more, this is increasing – in Taylor’s last 100 ODI matches, dating back to 2010, he averages an astonishing 49.28.

4. A sequence of three consecutive ODI tons, one of only six batsmen in history to have achieved this.

5. Taylor easily has more international tons than any other Kiwi batsman – 31 (16 in 78 Tests and 15 in 176 ODIs). His closest rivals are Nathan Astle with 27, Kane Williamson with 22 and Martin Crowe with 21. Even Stephen Fleming, for so long New Zealand’s best batsman, managed a comparatively feeble 9 Test tons in 111 Tests and 8 ODI tons in 279 matches, about a third of Taylor’s century rate.

On top of all this, Taylor was a great batsman for several years when we had no-one else who was much good. Back in 2006, when Taylor made his ODI debut, McCullum was a floater, Astle and Fleming were past their best and we had no-one else.

Instead of coming in after Martin Guptill (averaging 42) and Kane Williamson (47), Taylor shared the top order with Lou Vincent (27), Hamish Marshall (27), James Marshall (25) and Craig McMillan (28). The statesmanlike Stephen Fleming was the best batsman in this side, and he averaged 32.

And Taylor has achieved all of these things while – and in this he is almost unheralded – playing in a sport that Samoans (Taylor’s mother is Samoan) generally don’t play. Taylor is himself aware of this, noting that most Polynesians choose to play a rugby code.

In this sense – straddling the European and the Polynesian worlds – Ross Taylor is the best possible kind of New Zealander. When he scores a ton and gives his pukana for the crowd and those watching on television, it’s symbolic of everything excellent about New Zealand. No-one who wasn’t a Kiwi could do what Taylor has done in the way that he has done it.

Given all of those accolades, it seems almost a formality to declare Taylor the most underrated Kiwi sportsman of all time.

Understanding New Zealand: Voting Labour

The Labour Party formed in opposition to the sort of capitalist interests that would later form the National Party. Predictably, then, voting for Labour in 2014 has a very strong negative correlation with voting for National in 2014 (-0.85), and a moderately strong negative correlation with median personal income (-0.51).

With no other party apart from the Conservatives (-0.63) do supporters of Labour differ from near as intensely. Voting for Labour in 2014 was not significantly correlated with any of voting Green (-0.03), voting New Zealand First (0.11) or ACT (-0.19). The only parties that had a significant correlation with voting Labour in 2014 were the ALCP (0.38), Internet MANA (0.41) and the Maori Party (0.41).

This latter point is mostly a function of the powerful racial divide between the two major parties. The correlation between voting Labour in 2014 and being of European descent is a whopping -0.76. With being of Pacific Islander descent it is even higher, but in the other direction: 0.78. This latter statistic, coupled with the fact that voting Labour in 2014 has a correlation of 0.42 with being Maori, suggests that Labour is actually a Polynesian party to a considerable degree.

The statistic that Labour Party leaders will rue more than any other is the correlation between voting Labour in 2014 and turnout rate in 2014, which was -0.67. This tells us immediately that any given Labour supporter is significantly less likely to actually cast a vote for their party, which brings to mind the saying “Left-wingers fall in love; right-wingers fall in line.”

A statistic that might surprise many is that the correlation betwen voting Labour in 2014 and having no religion is -0.50. Although this can mostly be explained by the fact that being of Pacific Island descent has a correlation of 0.46 with being a Christian, it also brings up a surprising difference between New Zealand and the United States, where poor religious people have been driven apart from their natural economic classmates by wedge issues such as abortion, a phenomenon which is yet to be replicated in New Zealand, despite the best efforts of Brian Tamaki.

There was a correlation of 0.47 with voting Labour in 2014 and being a Hindu, which probably is a reflection of heavy Fijian Indian immigration over recent decades.

Although voting for Labour in 2014 had a significant correlation with having no qualifications, this was a barely significant 0.34. Some might be surprised that voting for Labour in 2014 had less of a correlation with not having a Master’s degree (-0.18) than voting Conservative did (-0.20). Considering that the average Labour voter is much younger, this suggests that the average Conservative is much more plebian.

The fact that the flag referendum was a National Party vehicle is demonstrated by the massive indifference of the working class to it. Voting for Labour in 2014 had a correlation of -0.84 with turnout rate in both the first and the second flag referendum, and a correlation of -0.80 with wanting to change the flag to the National Party design.

Perhaps the most interesting thing about the Labour Party vote is the size of the negative correlation with median age, which is -0.70. This is even lower than the Maori Party’s -0.66 and is far lower than the Green Party’s -0.17, which tells us that Labour is much more a party of the youth than the Greens (although this can be explained to a large extent by the fact that Polynesians are young and they seldom vote Green).

*

This article is an excerpt from Understanding New Zealand, by Dan McGlashan, published by VJM Publishing in the winter of 2017.