This article looks at what we can tell about the preferred industries of certain voting blocs based on their voting patterns. For the most part, the statistics in this area are fairly predictable, because industry types tend to be class defined and we already know which social classes vote for which parties.
There were few occupations that correlated with a significantly lower vote for the National Party in 2014, which is not surprising considering that National won the election. The most prominent was the transport, postal and warehousing industry, who had a correlation of -0.51 with voting National in 2014. As mentioned above, this can likely be best explained by the fact this is generally a working class industry.
It was a different story with rental, hiring and real estate services, which had a correlation of 0.49 with voting National. This is also not particularly surprising as it is an industry that essentially tries to generate money without performing any labour, i.e. by rent-seeking. Real estate agents and property managers are known for being the types that will do anything for a buck.
For the Labour Party these roles were, unsurprisingly, reversed – the transport, postal and warehousing industry had a correlation of 0.55 with voting for the Labour Party, probably reflecting the fact that if a Kiwi drives for a living they are very likely to be some kind of bogan and therefore a natural Labour voter.
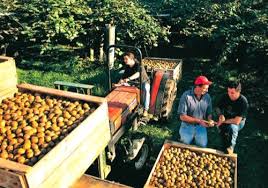
One statistic that will surprise many is the voting pattern of people in the agriculture, forestry and fishing industries. Many would expect people in these primary industries to vote Labour or Green, but it is not the case. These people are more likely than anyone to vote New Zealand First – there is a correlation of 0.40 between being in agriculture, forestry or fishing and voting New Zealand First, compared to -0.31 for Labour and -0.24 for the Greens.
This can be explained to some extent by the fact that people working in agriculture, forestry and fishing are more likely than average to be Maori (the correlation between the two is 0.22), and Maoris are significantly more like to vote New Zealand First.
The interesting thing about that is it shows the people who vote Green seldom actually have anything to do with the environment, because they usually live in wealthy neighbourhoods in big cities.
Green voters are more likely than any others to be students – being on the student allowance has a correlation of 0.55 with voting Green in 2014, compared to 0.34 for Labour, -0.18 for New Zealand First and -0.46 for National. They are also more likely than any other to work in hospitality – voting Green in 2014 had a correlation of 0.52 with working in accommodation.
Green voters are the ones most likely to be involved in the new technological occupations. Even though Green voters are older than Labour ones, voting for them correlates more strongly with high-tech occupations than voting for Labour does. Voting Green in 2014 has a correlation of 0.63 with working in professional, scientific and technical services, and a correlation of 0.70 with working in information media and telecommunications.
The Greens also overwhelmingly dominate the arts and recreational services industry. People working in this industry have a correlation of 0.69 with voting Green in 2014, compared to -0.17 for National voters, -0.13 for Labour voters and -0.18 for New Zealand First voters.
Oddly, there’s a pattern based on benefit type. Pensioners vote National (correlation: 0.50), unemployment beneficiaries vote Labour (0.62), students vote Green (0.55) and invalid’s beneficiaries vote for the Aotearoa Legalise Cannabis Party (0.76).
This latter correlation is both very strong and will be very surprising to many, until one considers that it is precisely invalid’s beneficiaries who suffer the worst from the Government’s refusal to reform our cannabis laws.
*
This article is an excerpt from Understanding New Zealand, by Dan McGlashan, published by VJM Publishing in the winter of 2017.
