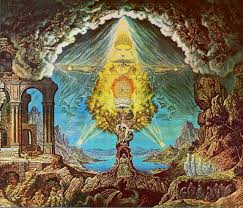
Dividing the Great Fractal along two particular masculine-feminine axes gives us four realms of human awareness. These axes arise in response to two fundamental questions about any new piece of knowledge that are natural for a conscious entity to ask themselves as reality becomes more apparent after the birth of a physical body.
The first question is “Is this knowledge actual knowledge or is it a lie masquerading as knowledge?” The second question is “To what area of existence does this knowledge pertain?”
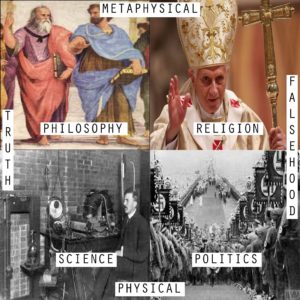
The first question gives us a basic division into truth and falsehood. The second question gives us a basic division into physical and metaphysical.
In the quadrant corresponding to both truth and physical, we have the realm of knowledge we call science. Human awareness probably entered this realm in conjunction with the mastery of fire, because it was not until then that the scientific method became necessary.
It was necessary for the mastery of fire because we had to learn, by trial and error for the most part, that dryness of the air was a factor that determined the possibility of starting a fire, as was the degree of contrast in terms of hardness of the two woods that were rubbed together, as was the temperature of the embers created by the friction.
This primitive scientific methodology led to the invention of the bow drill – a technological leap as ingenious as anything humanity has taken since, and one that increased our chances of survival in nature by more than any other. All scientists are the spiritual descendants of those early shamans who had the courage to master fire.
In the quadrant of truth crossed with metaphysical, we have philosophy. This arguably preceded the mastery of fire. More likely, though, it arose as a consequence of the leisure time that itself was created as a consequence of the massively increased efficiency of food consumption afforded by the ability to cook food in fire and therefore pre-digest it.
In other words, because eating cooked food was hyper-efficient it gave early man an opportunity to relax, and this brought with it consideration of basic existential questions like “What the fuck is going on here?”
The advent of philosophy massively increased human survival prospects because it allowed us to think ahead in a rational manner. This naturally led to an appreciation of the cycles of nature such as the seasons and the tides, and the migration patterns of the game animals upon which nomadic tribes depended.
These two realms of human awareness increased human survival chances so much that our population began to swell to a degree that could not be sustained by the hunting and gathering practices of the time. This overpopulation naturally led to increased competition for the now relatively scarcer resources.
It would have soon been apparent that this increased population led to increased violence. There was one way around it, though: there is one way to compete with one’s fellows without using violence, and that is by telling lies.
This mixture of the physical world and falsehood is the realm of human knowledge that we know as politics.
The earlier developmental stages of politics can be observed in the ever-shifting alliances of chimpanzee troops. Essentially the objective of politics is to position oneself or one’s group so that one is in an optimal position to compete for scarce resources without violence.
For example, it can be seen that in our modern civilisation that the men of silver generally have an easier time attracting fertile women than the men of iron. This is because being of silver – a part of which having the capacity to derive advantage by telling lies – is more closely associated with having a capacity for resource acquisition.
The politics of today have arranged the minds of the rest of us so that if the man of iron tries to take what he wants by force, as he did in prehistoric times without anyone being able to stop him, he will be outgunned by the Police.
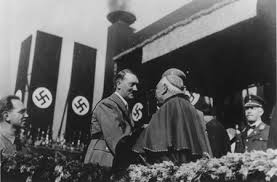
The simplest way, however, to arrange a group of people so that they will do whatever you tell them is with religion. This is why the intersection of the metaphysical and falsehood is the quadrant of religion.
That philosophy and religion are the opposing poles of one axis can be understood by knowing that the purpose of philosophy is to enlighten and the purpose of religion is to confuse.
Make no mistake – the purpose of religion is to confuse its victims into passivity, from where they can be herded wherever their shepherd desires. This is why religious scriptures are absolutely riddled with contradictions.
These contradictions, such as the Biblical admonitions to both love thy neighbour and to destroy all enemies of God, have not arisen because the authors of these texts were philosophically unsophisticated.
Quite the opposite. It has been known since Babylon that if you can rot the minds of the populace with moral confusion they will become compliant with any decree from a ruler, as long as that decree promises to impose the order that all confused people desperately crave.
Telling lies, therefore, is an end in itself to both political and religious rulers. This point cannot be overemphasised if one wishes to make sense of the world.