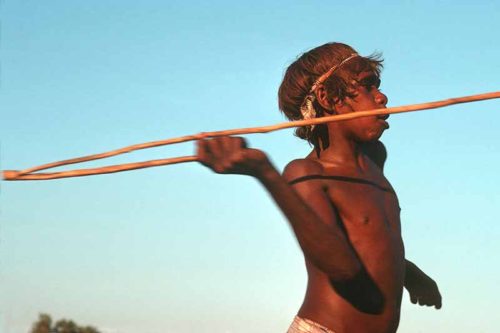
The invention and refinement of the spear was one of the first significant applications of human intelligence
All regular readers of this column will be familiar with four temperaments theory, which is the idea that humans fall into four psychological groups that correspond to the four feminine elements of earth, water, air and fire. As a previous essay discussed, these four elements could be considered to be the four feminine elements of equal value, in contrast to the four masculine elements of varying value. This essay looks at the four temperaments according to the four masculine elements.
The most elementary sort of person is the one that exists in the state of nature. This corresponds to the man of clay. This is how people are when we’re not significantly distinguished from the rest of the animal kingdom – in other words, when we’re just a third chimpanzee.
In esoteric terms, this is a person with no divine inspiration. Such a person will not feel any reason to question the various animal impulses that come through their mind, and consequently they will behave much like an animal. They will be aggressive, vicious, spiteful, brutal, jealous and envious.
Divine inspiration manifests in the man of iron as someone with a concept of discipline. At the most primitive level, this means someone who is able to overcome their fear of physical suffering in order to hold fast and resist an enemy, usually in the form of another man or a predatory animal.
At the most primitive level of humanity, this is how people came to distinguish themselves from the ordinary ape-man, and this is therefore how humanity began to evolve into something higher. Tuning into this frequency of iron meant learning the virtues of bravery and courage which, when applied to death, allow a person to act as something more than just a fear, hunger and sex-based animal.
After a certain critical mass of iron was reached, some of it began, like fusion in the heart of a star, to brighten into silver. This was when people came to learn that intelligent application of discipline was better than discipline for the sake of discipline.
This was also the point at which humans started to use their brains and intellects to secure survival and reproductive advantages. A crucial stage in this process was the invention of the spear. The application of intellect necessary to first realise that a spear is a more effective weapon than a club, and second to improve it by hardening the tip in fire, catapulted humanity forward.
The value of silver is in that it is softer than iron and can therefore be used to direct iron in subtler ways. When humanity started to appreciate this value, then iron was consciously polished into silver for the first time.
This led to a third type of person, one who was neither animal nor knight but somewhere in between. This person carved a niche for themselves out of reality primarily through their minds, i.e. through the application of intelligence. On an alchemical level, this sort of person corresponds to the element of silver.
Music began to develop at this point, as did language more complicated than the growls and hisses that we shared with other mammals like cats and monkeys. Evidently, people decided that they naturally liked that sort of thing because all cultures developed a musical tradition and a tradition of singing.
The real development of silver, however, wasn’t in levity but in lying and cheating and scheming and plotting, either against other people or other animals in hunting or nature itself in agriculture. Silver is not gold, and intelligence is entirely separate from morality.
Most humans don’t develop much past this stage of silver, if they even get that far. But for those who did, the next step was the advent of philosophy, and alongside that came the ritual use of psychoactive drugs.
The first of these drugs to be used ritually was probably psilocybin mushrooms or amanita muscaria, followed by ayahuasca, alcohol and then cannabis. Mushrooms are the obvious choice for ritual use because they require no real preparation (although ought to be dried for reasons of palatability) and because they spring up at at a regular and predictable point in the seasonal cycle.
Once this started to happen, humans started to develop a sense of spirituality. The broader perspectives offered by the altered states of consciousness that were deliberately entered into, often enough for a shaman to learn to navigate in them, allowed for an appreciation of something much greater than oneself, an insight into higher levels of the Great Fractal.
Once insights like this were reached, it became possible for consciousness to affect reality on the level of gold, which is to say, the level of correct conduct.
This led to a fourth sort of person, one who is capable of guiding and influencing all of the other elements despite being soft like the clay. This person was able to lead by example, and therefore did not need to be strong like iron or quick-thinking like silver. This sort of person is rare enough that they are like the gold.
This sort of person took the role of the shaman in ancient society, in that they were a person who experimented with altered states of consciousness for the sake of maximising the breadth of their perspective on reality. This path requires both the courage of iron and the cunning of silver, and in this manner is like a synthesis of the two.
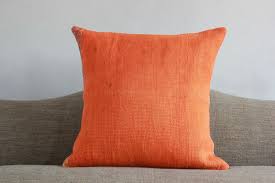
A woman goes to lie down with a bright orange-coloured pillow.
Chair – tūru
Balanced precariously on a small chair are two kangaroos (two roos).
Bed – moenga
A bedroom looks photographically realistic except for the bed, which is drawn in Manga-style with Japanese characters on the bedding.
Mat – whāriki
A young man is sitting on a toilet and looking down at the mat in front of him. The mat starts swirling in a range of terrifying colours and he says “Freaky!”
Sheet – hīti
A man is lying in bed on a sweltering night. He cries out “Oh, the heat!” and then strips his bed down to the sheets.
Mirror – whakaata
A woman looks at herself in the hand mirror and notices, in the reflection, Dan Carter, far in the distance. In the mirror is the Far Carter.
The Maori word for ‘pillow’ – urunga – sounds like the English word ‘orange’
Brush – paraihe
A boy holding a large brush in his hands kneels down to pray.
Stairs – arapiki
An arrow walks up a set of stairs outside a house and then peeks through a window. He is the arrow peeker.
Table – paparahua
A young boy is sitting at a beach when a man comes by, rowing on an upended table. The boy says “Papa! Row here!”
Clothespeg – mātiti
A fat young boy puts a clothespeg on his own chest and says “Ow, my titty!”
Telephone – waea
Two people in adjacent houses are talking to each other on telephones, but there is a wire connecting both of the phones and they can’t move further away from each other.
Couch – hāneanea
A man is lying on a couch watching a video of two women fighting MMA-style. From deep in the couch he cheers “Ha! Knee her! Knee her!”
*
The above is an excerpt from the upcoming Learn Maori Vocabulary With Mnemonics, by Jeff Ngatai, due to be published by VJM Publishing in the summer of 2017/18.
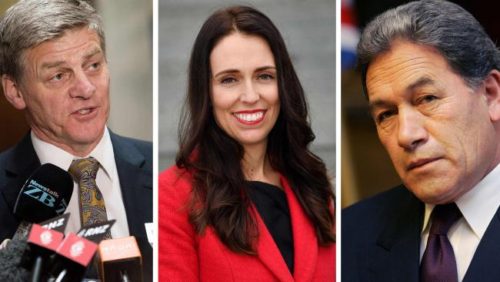
Is has been argued that Winston Peters ought to go with whichever side is most like New Zealand First demographically – but which is it?
There are many competing reasons for thinking that Winston Peters ought to go with one or the other of Labour or National in the post-election negotiations to form a Government. Some say that any arrangement with the Greens involved will not be stable enough, some say that the Opposition parties won a clear majority and therefore a mandate for change, some say that Winston will go with whoever he feels like going with. This article, by Understanding New Zealand author Dan McGlashan, looks at things another way.
We will follow here the argument that Peters ought to side with whichever out of Labour and National represents the people most similar to their own, and to that end this article will make a judgment using six major demographic categories, viz. age, ethnicity, education, income level, gender and homeownership rates.
Age
The correlation between voting National in 2017 and median age was a very strong 0.77, which represents the old people who own everything, and between voting Labour in 2017 and median age it was -0.66, which represents the people who are yet to become financially established and are living primarily on their wages.
The correlation between voting New Zealand First in 2014 and median age was negative, at -0.08, but by 2017 it had become significantly positive, at 0.24. This is primarily because of a large number of young, working-class Maoris shifting to Labour.
Young people drifted away from New Zealand First this election, and old people drifted in. The correlation between being aged 20-29 and voting New Zealand First was -0.38 in 2014 but had become -0.60 by 2017, whereas the correlation between being aged 65+ and voting New Zealand First was 0.10 in 2014 and had become 0.36 by 2017.
Young voters tend to not like either National or New Zealand First, whereas elderly voters like both, so that suggests a greater age overlap with the National Party. Decisively, the correlation of 0.24 between voting New Zealand First in 2017 and median age is 90 basis points away from the Labour figure, and only 53 basis points away from the National figure, so National win this one.
National 1, Labour 0
Ethnicity
The stereotype is of New Zealand First as an old, white, racist’s party, which is a very odd perception when it’s led by someone who played for the Auckland Maori rugby team. The truth is much more complex.
Voting New Zealand First in 2014 and being a Kiwi of European descent was perfectly uncorrelated, at 0.00. Between voting New Zealand First in 2014 and being Maori the correlation was a strongly positive 0.66. That means that at the time of the last election, the stereotype of New Zealand First voters was entirely false.
Some truth crept into it in 2017, however. By 2017 the correlation between being a Kiwi of European descent and voting New Zealand First had risen to 0.19, whereas the correlation between being Maori and voting New Zealand First had fallen to 0.40. This means that New Zealand First is still more of a Maori party than it is anything else, but that sentiments of white Kiwis are also well represented.
The correlation between being a Kiwi of European descent and voting National in 2017 was a strong 0.51, and for voting Labour it was correspondingly weak, at -0.56.
This means that New Zealand First is slightly more like National when it comes to whiteness, but far more like Labour when it comes to Maoriness. The correlation between being Maori and voting National in 2017 was a strongly negative -0.68, whereas the figure for voting Labour in 2017 was, at 0.57, very close to the New Zealand First figure.
New Zealand First was fairly to similar to National in that their party was mildly disfavoured by Pacific Islanders, in contrast to Labour. The correlations between being a Pacific Islander and voting National or New Zealand First in 2017 were -0.35 and -0.17 respectively, very different to the correlation between being a Pacific Islander and voting Labour, which was, at 0.57, as strong as the one with being Maori and voting Labour in 2017.
This is unlike the case of Asians, who were moderately more likely to prefer National to Labour, and who despise New Zealand First. The correlation between being Asian and voting National in 2017 was 0.10, only a smidgen stronger than what it was in 2014. Between being Asian and voting Labour in 2017 it was -0.09, but between being Asian and voting New Zealand First in 2017 it was -0.58.
All in all, if you weight each ethnicity by the number of Kiwis belonging to it, it’s more or less a draw.
National 1.5, Labour 0.5
Education
Labour shares with New Zealand First an affinity from those with few NZQA qualifications. New Zealand First was by far the most poorly educated voting bloc in 2014, and, although it’s true that they still are, the margins became smaller.
The correlations between having no NZQA qualifications and voting New Zealand First or Labour in 2017 were similar, at 0.69 and 0.45 respectively, and very different to that of having no NZQA qualifications and voting National in 2017, which was -0.32.
This isn’t really surprising because someone with no NZQA qualifications is not likely to have a large income or a number of rental houses, and so will not benefit from National’s refusal to institute a capital gains tax, and they are very likely to be living hand to mouth or close to it, which means they lost out from the rise in GST to 15%.
Some will be very surprised by the voting patterns of the highly educated, though. On the one hand, it might not be surprising that the university educated were mildly disinclined to vote Labour in 2017. The correlations with doing so were -0.32 for people with a Bachelor’s degree, -0.28 for people with an Honours degree, -0.27 for people with a Master’s degree, and -0.21 for people with a doctorate.
But neither were they particularly inclined to vote National. The correlations with voting National in 2017 were 0.15 for having a Bachelor’s degree, 0.10 for having an Honours degree, and 0.09 for having either of the two highest degrees. As it turns out, a large number of these people voted TOP, ACT or Green.
Compared to their sentiments towards Labour and National, university graduates are extremely disinclined to support New Zealand First. The correlations between voting New Zealand First in 2017 and having a university education was -0.73 in the case of having a Bachelor’s degree, -0.69 for an Honours degree, -0.74 for a Master’s degree and -0.60 for a doctorate.
This suggests that neither Labour or National have much in common with New Zealand First educationally, but Labour does share with New Zealand First a supporter base of very uneducated people. This is worth three-quarters of a point to Labour and one quarter to National.
National 1.75, Labour 1.25
Income
Leaving aside the truly broke, who know that their bread is buttered with Labour, not National, and who are indifferent to New Zealand First, voters in every income band are about equally likely to prefer Labour and New Zealand First to National.
The most wealthy Kiwis dislike New Zealand First even more than they dislike the Labour Party, which is perhaps a commentary on how the Labour Party supports the wealthy by way of supporting neoliberalism.
People with an income of $150K+ had a correlation of 0.24 with voting National in 2017, -0.43 with voting Labour in 2017 and -0.51 with voting New Zealand First in 2017, and those with an income of $100-150K had a correlation of 0.26 with voting National in 2017, -0.40 with voting Labour in 2017 and -0.54 with voting New Zealand First in 2017.
This suggests that the people who are creaming it the most look at Labour and New Zealand First with a similar level of disdain.
People in the $50-60K income band were almost perfectly indifferent to all three parties. The correlation between being in this income band and voting National in 2017 was 0.01, with voting Labour in 2017 it was -0.03 and with voting New Zealand First in 2017 it was 0.04.
This tells us that people in the middle – either the young, poor, ambitious and going up or the old, middle-class, satisfied and looking to hang on – wouldn’t really mind which way Peters went.
The people in the working-class income bands between $25 and $40K, in contrast to those in the $100K+ income bands, look at Labour and New Zealand First with a similar level of approval.
Kiwis earning $35-40K had a correlation of 0.49 with voting New Zealand First in 2017, which is much closer to the correlation between being in this income band and voting Labour in 2017 (0.38) than it is to the one between being in this income band and voting National in 2017 (-0.37).
In the income bands lower than this, people tended to support New Zealand First all the more. To the poorest New Zealanders, there is no apparent difference between National and Labour, and such a mindset seems to find a home in New Zealand First.
Ultimately, wealthy Kiwis like National and dislike Labour and New Zealand First, and poor Kiwis dislike National and like Labour and New Zealand First, so this one goes to Labour.
National 1.75, Labour 2.25
Gender
The correlation between voting National in 2017 and being male was 0.23, understandable as men earn more money than women and are therefore relatively likely to lose from the balance of taxation and welfare spending.
The correlation between voting Labour in 2017 and being female was 0.40, also understandable for the opposite reasons to why the men vote National – women earn less money and therefore benefit more from a party that raises taxes for the sake of social spending.
New Zealand First voters fell right in the middle. The correlation between voting New Zealand First in 2017 and being female was 0.10, which placed it almost exactly as far away from the National figure as from the Labour one.
In other words, New Zealand First voters were slightly more likely to be female, which fell in between National’s moderately more likely to be male and Labour’s strongly more likely to be female.
National 2.25, Labour 2.75
Homeownership
Curiously, the correlations between living in a mortgaged house and voting in 2017 for any of the three parties under discussion were basically identical. For National and Labour it was both 0.16, and for New Zealand First it was 0.14.
For living in a freehold house, things were a bit different. Predictably, people who lived in freehold houses were much more likely to vote National than Labour. The correlation between living in a freehold house and voting for National in 2017 was 0.65, and with voting for Labour in 2017 it was -0.51.
But people who voted New Zealand First fell almost right in the middle – the correlation between living in a freehold house and voting New Zealand First in 2017 was 0.22. This might be marginally closer to National but this was not the case in 2014. At that election, voting for New Zealand First had a correlation of -0.05 with living in a freehold house.
A similar pattern presented itself for those who were renters. The correlation between living in a rented house and voting for National in 2017 was a very strong -0.79, and with voting for Labour in 2017 it was also fairly strong, but in the other direction, at 0.56.
Again, New Zealand First voters fell in the middle. The correlation between living in a rented house and voting Nw Zealand First in 2017 was -0.26, which again falls right in between Labour and National. This one has to be another tie, at half a point each.
Final score: National 2.75, Labour 3.25
In the final analysis, it would be far from easy for Peters to choose between Labour and National on the basis of demographic similarities. Age would push him towards National, income towards Labour, and gender and homeownership rates would be even.
This makes for a very strong negotiating position in one sense. Unlike the Green Party – who cannot support National without committing suicide in the manner of the Maori Party and the British Liberal Democrats – New Zealand First could plausibly support either Labour or National, meaning that either side has an incentive to offer as much as it can to them.
However, Winston Peters has also been forked. He has to make one group of committed New Zealand First supporters unhappy. Either he makes the elderly European contingent unhappy by going with the Green Party, or he makes the working-class Maori contingent unhappy by going with National.
No doubt this calculus means that Peters will take his sweet time, and consider every possibility, before deciding on whose head he will place the crown.
*
This article is an excerpt from the 2nd Edition of Understanding New Zealand, which Dan McGlashan and VJM Publishing will have ready for sale at the end of October 2017. This will contain statistics calculated according to the official final vote counts and will be freshly updated with data from the 2017 General Election.
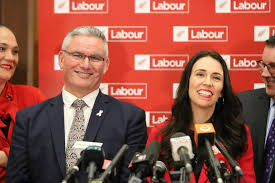
The Labour Party won about 10% more of the electorate in 2017 than they did in 2014 – but where did these new voters come from?
The Labour Party under Jacinda Ardern won an extra ten percent of voters compared to the previous election. In 2014, under David Cunliffe, they won a paltry 25.1% of the total vote, but in yesterday’s election they won 35.8% (specials are yet to be counted but shouldn’t affect Labour’s vote percentage much). This article, by Understanding New Zealand author Dan McGlashan, looks at where they won these new voters from.
In the broadest and crudest sense, the Labour Party won a lot of support back from middle-class, middle-aged to elderly white people who had previously voted National, and from Maoris who had previously voted New Zealand First.
The correlation between voting Labour in 2014 and being a Kiwi of European descent was -0.76, but by 2017 this correlation had weakened to -0.56. This shift from negative to positive was replicated by the correlation between being Maori and voting Labour, which was 0.42 in 2014 and which had strengthened to 0.57 by 2017.
Taken together, these statistics suggest that Labour strengthened their position among the New Zealand-born. Indeed, we can see that the correlation between being born in New Zealand and voting Labour in 2014 was not significant at 0.01, but it had grown sharply to a mildly significant 0.30 by 2017.
This was met by corresponding drops in support from demographics who have a high proportion of immigrants. The correlation between being born in the Pacific Islands and voting Labour was 0.68 in 2014, and this fell to 0.43 in 2017, and also the correlation between born in North East Asia became more strongly negative, from -0.17 in 2014 to -0.35 in 2017.
These can be explained by the fact that some Pacific Islanders have been here long enough now to become part of the middle class. Conservative religious sentiments might have pushed some to National as well. Likewise, many of the Asian immigrants who have arrived recently are the moneyed classes looking to shift capital from Asia, and are different to the younger, educated Asian immigrant that Labour tended to let in.
There was already a notable gender gap when it came to supporting one of the two major parties. The correlation between being female and voting Labour in 2014 was already 0.31, but by 2017 this had strengthened to 0.40. There was also a very large reduction in the strength of the correlation between working part time and voting Labour. This was -0.65 in 2014 and -0.40 in 2017.
The Labour vote was also a fair bit older in 2017.
The correlations for older age groups, on the other hand, became less strongly negative. The 50-64 age bracket had a correlation of -0.68 with voting Labour in 2014, but this had fallen to -0.59 by 2017. Likewise, the 65+ age bracket had a correlation of -0.58 with voting Labour in 2014, and this fell to -0.51 by 2017.
An interesting point here is that the correlation with being born in Britain in 2014 (-0.73) remained equally as strongly negative in 2017. So this tells us that a much greater proportion of this middle-aged to elderly group that switched from National to Labour were people with family in New Zealand, probably therefore grandchildren.
It might be that these people, having observed the sharper effects of neoliberalism on their wider family, no longer felt motivated to support it in the same way they did in 2014. After all, it was mostly this same group of people who made the most cash out of National’s immigration policies.
Further clues come from the patterns of voters based on their industry. Some industries shifted sharply towards Labour in 2017. Most notable were healthcare and social assistance (which had a correlation of -0.00 with voting Labour in 2014 compared to 0.20 in 2017) and education and training (which had a correlation of -0.01 with voting Labour in 2014 compared to 0.17 in 2017). Also notable is that the occupation of community and personal services workers had a correlation of 0.20 with voting Labour in 2014, increasing to one of 0.36 in 2017.
What this might suggest is that Kiwis whose jobs put them into contact with other people were the most likely to switch from National to Labour.
It could be that the type of Kiwi who is an everyday grandparent, and who has taken on a social conscience in their semi-retirement, has switched some of their sentiments away from National because of a lack of confidence in the belief that they would leave a good New Zealand to their grandchildren.
Looking at the statistics of the income bands, we can see that Labour’s surge won it back much of the middle ground. Although Kiwis with an annual income of less than $15K continued to overwhelmingly favour Labour, there was a swing towards them in the income bands of those groups in the centre.
The correlation between having a personal income of $15-20K and voting Labour rose to 0.13 in 2017 from -0.05 in 2014, and the correlation between having a personal income of $20-25K and voting Labour rose to 0.10 in 2017 from -0.09 in 2014. Even though these income bands are the common student ones, it was not there that the gains were made – the correlation between being on the student allowance and voting Labour in 2017 was, at 0.32, weaker than it had been in 2014 (0.34).
Taking into account the big Labour gains among part-time workers, what all this suggests is that a middle-class, elderly group of voters, probably with wider community ties and a stronger historical sense of what the country used to be like, have come to feel that Kiwi values are no longer represented by the direction the country is taking.
It’s important not to overplay this – the bulk of wealthy, older, white voters still went with National – but there is a clear trend evident. The electorate is simply not as convinced that the country is going in the right direction anymore, and the centre is starting to shift towards Labour.
*
This article is an excerpt from the 2nd Edition of Understanding New Zealand, which Dan McGlashan and VJM Publishing will have ready for sale at the end of October 2017. This will contain statistics calculated according to the official final vote counts and will be freshly updated with data from the 2017 General Election.