
Category: politics
Latest Frontiers in the War on Free Speech in the West

Free speech is the foundation of civilisation. Without it, it’s not possible for a person to express their discontent with the way things are, and without an outlet for discontent it will inevitably turn into violence. As John F Kennedy told us, “Those who make peaceful revolution impossible will make violent revolution inevitable.”
There are powerful political movements in the world today who have calculated that criminalising free speech benefits their agenda, despite this risk. These movements usually have a kind of feminine logic at their core, in that they consider themselves to be righteously resisting masculine excesses like discrimination.
Most are predicated on the moral assumption that, in any conflict between two forces, the weakest force must automatically be the morally correct one, on the grounds that the weaker side would not start a conflict that they would lose.
After some decades of percolating away in sick heads disconnected from reality, this assumption has led the social justice warriors to now believe in the moral imperative of destroying all hierarchy on the grounds that it is necessarily masculine and therefore inherently evil.
No consideration is given to the concept of correct hierarchy that leads to good order – such a thing is simply axiomatically defined as impossible. All order is bad, therefore all must be destroyed.
Such a morality naturally leads to the idea that all weakness is inherently good – hence the resurgence of what Nietzsche would have called “slave morality” in the West.
This explains why so many are bleating the catchphrase of the modern moron: “Hate speech is not free speech” – where hate speech is defined as the promulgation of facts that, despite being true, are politically inconvenient to those who are anti-hierarchy.
In particular, any fact which suggests that a particular hierarchy might be natural and inevitable has to be the most strenuously opposed. As Nietzsche pointed out, the reason for this is the resentment that these weaklings have towards those strong enough to impose good order upon themselves, for it is good order imposed upon oneself that leads to rising in worldly hierarchies.
For instance, the proposition that the text of the Koran will lead inevitably to violence is vociferously opposed by those who want to propagate the impression that the wars in the Middle East are caused primarily by Western interference.
Likewise, the proposition that Islamic terrorism in Europe is a natural consequence of the text of the Koran is opposed by those who want to propagate the impression that the terrorism is blowback for Western interference.
Unsurprisingly, such propositions – entirely independent of any historical or logical validity they might have – are increasingly lumped under the general rubric of “Islamophobia.”
They join propositions such as statements about racial differences in intelligence, or about gender differences in propensity towards certain patterns of behaviour, as politically incorrect ones.
The latest frontier in the war on free speech is attempts to criminalise the free expression of such propositions.
Already there is a concerted movement that means to make it illegal to point out the obvious connection between Koranic verses calling for violence and Islamic expressions of violence, or the obvious connection between the belief that a paedophile was the perfect man and culturally lax attitudes to paedophilia.
The tragedy is, the only reason why the West is no longer an oppressive shithole like the Islamic World is that we have spent the last four centuries using our freedom of speech and expression to destroy the evil of Abrahamism in its manifestation of Christianity.
And, in much the same way that the West was an oppressive, miserable shithole when it was illegal to criticise Christianity, so too will it be an oppressive, miserable shithole when it is illegal to criticise Islam.
What has to happen is a cultural shift where screaming “Racist!” or “Bigot!” at someone is no longer socially sanctioned as legitimate discourse. There needs to be a mass awakening to the fact that this strategy of political manipulation has the overall effect of suppressing honest discussion, and therefore is detrimental to everyone in society, and to society as a whole.
This will require sane people uniting around the spirit of genuine inquiry into the nature of reality, and in opposition to the egomaniacs who are trying to remake the world in their image by force.
And that means uniting around a shared appreciation that free speech keeps us safe from all kinds of excesses, even politically correct ones.
After all, it’s not a coincidence that the Anglosphere, with the strongest cultural appreciation of the value of free speech, has kept itself safe from totalitarianism for the longest time.
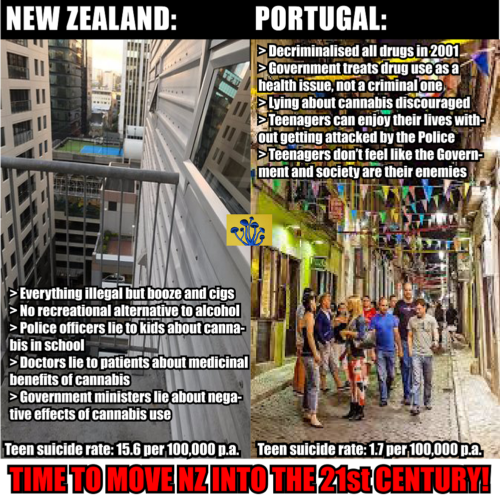
The Only Reason to Still Oppose Medicinal Cannabis is Sadism
The New Zealand Parliament will soon get another chance to bring our cannabis laws into the 21st century, with Julie Anne Genter’s Misuse of Drugs (Medicinal Cannabis and Other Matters) Amendment Bill drawn from the Member’s Bill Ballot this week. This ought to herald the long-awaited national conversation on the subject.
The Bill allows for any Kiwi suffering from “any debilitating condition” to use cannabis or a cannabis product if they have approval from a doctor. It also allows for such patients to cultivate cannabis themselves or to nominate someone to do it for them.
This latter point is extremely important and often underappreciated. One of Peter Dunne’s strategies to keep cannabis illegal by boondoggle has been to restrict supply to extremely expensive overseas sources, such as Sativex (which costs over $1,000 per month), instead of simply allowing people who need it to cultivate it themselves. This Bill would remove this deliberately-placed hurdle.
As Genter points out, the decision to make cannabis illegal was not based on evidence in the first place. Doctors in the 1930s were prescribing medicinal cannabis to patients in New Zealand, as they were all across the world.
The decision to stop doctors from prescribing cannabis was pushed on us by moronic do-gooders forcing their Puritan ideology on the rest of the world.
There was never any science involved, nor any common sense, foresight, empathy, compassion or concern for good order.
From the beginning, cannabis prohibition was based on nothing but a sadistic need to control the masses through causing them suffering, and on the gullibility of legions of morons willing to bleat whatever they heard from an authority figure as if it was the Word of God.
For a person to still not know that cannabis is medicinal they have to be willfully stupid.
The Aotearoa Legalise Cannabis Party first stood in a General Election in 1996. Already in 1996 the party platform had the need for medicinal cannabis as one of its core tenets.
In 1996 it got 1.66% of the vote, so even twenty years ago it was true that one in sixty Kiwis considered cannabis law reform a major issue. After all, California legalised medicinal cannabis that year, so the medicinal properties of cannabis were already known and accepted by experts even then.
Since then, twenty-eight US states have made medicinal cannabis legal and eight have made recreational cannabis legal – and none of them have gone back to prohibition after making the change.
So to deny that cannabis law reform is inevitable is like denying that a heavyweight boxer who has won forty consecutive knockout victories is a title contender.
For a person to continue to believe that the prohibition of medicinal cannabis helps New Zealanders, they have to possess a willful ignorance that borders on malice.
They would have to continue to ignore all the stories from hundreds of medicinal cannabis users, over twenty years, in which they detailed the reduction in suffering that cannabis gave them.
They would have to think nothing of the fact that supporters of medicinal cannabis are winning a victory every month either in New Zealand or in another Western jurisdiction.
They would have to believe that it was fair that any of Martin Crowe, Paul Holmes and Helen Kelly could have been prosecuted and sent to prison for using medicinal cannabis to alleviate pain caused from dying of cancer.
And a person cannot think like that unless they purposefully deny reality for the sake of bringing cruelty into the world.
When the debate about medicinal cannabis does, finally, after over twenty years of campaigning, happen in Parliament, the MPs who oppose it will mark themselves out as particularly sadistic old dinosaurs who need getting rid of.
Understanding New Zealand: Demographics of Flag Referendum Voters

Given what is already known about the demographics of the various party voters, we can tell a lot about who supported the flag referendum just by looking at the correlations between voting for a given party and one of three other major variables.
The first major variable is the turnout rate in the first flag referendum.
The correlation between turnout rate in this first referendum and voting National was a very strong 0.86. That is enough by itself to suggest that the bulk of the people who did end up voting in it were National supporters.
The correlation between turnout rate in 2014 and voting National was, however, 0.76, so we can see that the people who voted in the first flag referendum were mostly those who are generally inclined to vote whenever they can. This was also true for Conservative Party supporters, who had a correlation of 0.70 with turnout rate in the first flag referendum.
Green, ACT and New Zealand First voters were only mildly interested. The correlation between turnout rate in the first flag referendum and voting Green was 0.07, with voting ACT it was -0.01 and with voting New Zealand First it was -0.21. None of these were significant.
Labour Party voters were almost entirely indifferent to the whole idea. The correlation between voting Labour in 2014 and turnout rate in the first flag referendum was a very strong -0.84.
This was something broadly shared by all of the Maori-heavy parties. The correlation between turnout rate in the first flag referendum and voting for both the Maori Party and Internet MANA was -0.67, and with voting for the Aotearoa Legalise Cannabis Party it was -0.55.
Predictably, given these statistics, it was mostly Kiwis of European descent who were interested in the first referendum. The correlation between being of European descent and turnout rate in the first flag referendum was 0.85.
The correlation between turnout rate in the first flag referendum and being either Maori or a Pacific Islander was -0.65, and with being Asian it was -0.27.
Perhaps the most striking correlation of all is that between turnout rate in the first flag referendum and turnout rate in 2014 – this was an extremely strong 0.90. Those who like to vote tend to take every opportunity they can to actually do it.
There was also a correlation of 0.89 between turnout rate in the first flag referendum and median age.
The correlations between wealth and turnout rate were significant, but only marginally so.
All of the income bands above $70K were significantly positively correlated with turnout rate in the first flag referendum, but only marginally so – the strongest of them was 0.31. None of the income bands below $70K had a significant positive correlation with turnout rate in the first flag referendum.
By contrast, all of the income bands below $10K had a correlation of -0.50 or more strongly negative, the strongest of all being for those who had a negative income. The correlation between being in this income bracket and turnout rate in the first flag referendum was -0.84.
Likewise, the correlations between education and turnout rate bordered on statistical significance.
Although there were significant positive correlations between turnout rate in the first flag referendum and having either an Honours degree (0.25) or having a doctorate (0.27), this was true for neither a Bachelor’s nor a Master’s degree (both 0.13).
Mirroring this, the correlation between turnout rate in the first flag referendum and having no academic qualifications was not especially strong, at -0.28.
One of the strongest correlations of all was between turnout rate in the first flag referendum and living on freehold land: this was 0.87.
All of this gives us a clear picture. The sort of person who turned out to vote in the first flag referendum was the same sort of person who is most heavily involved in running the country: rich, old, white and National voting with leisure time.
The second major variable is the turnout rate in the second flag referendum. Here it is only really meaningful to speak of the differences in voting pattern to the first flag referendum.
Although the second flag referendum was still mostly a vehicle for Kiwis of European descent (the correlation between the two demographics strengthened from 0.85 to 0.88), the people who turned out for it tended to be more Maori. The correlation between turnout rate in the second flag referendum and being Maori came in to -0.57 from -0.65.
Against this, turnout rate for the second flag referendum faded among Pacific Islanders and Asians. This may have been because the further the process wound on, the more likely the least established Kiwis were to drop out of it.
People who voted Green were also less likely to turn out in the second flag referendum. The correlation between the two fell to 0.02 from the 0.07 of the first flag referendum. This was probably because the correlation between being in the 20-29 age bracket and turnout rate fell from the -0.41 of the first flag referendum to the -0.50 of the second.
All of this reflected the fact that the second flag referedum saw a considerably higher turnout rate among those who did not want to change the flag. The correlation with voting to change the flag fell from 0.86 for the first flag referendum to 0.80 for the second.
The third major factor is the percentage of people who voted to change the flag.
These people were almost all National voters. The correlation between voting National in 2014 and voting to change the flag in the second flag referendum was a whopping 0.95. This is an extremely strong correlation, and it tells us that basically the only people to even vote to change the flag were died-in-the-wool National voters.
Maoris really didn’t want to change the flag – the correlation between the two was -0.77. These numbers suggest that there was a small core of Maoris who knew from the beginning of the process that they didn’t want to change the flag, but who waited until the second flag referendum to voice their disapproval.
Asians were a curiosity, because they had a negative correlation with turnout rate in either referendum, but a slightly positive correlation of 0.11 with voting to change the flag.
Some will find it very curious that the old were much more likely to vote for change than the young, which goes against the usual pattern of the old being more conservative.
The correlation between being aged 65+ and voting to change the flag was a very strong 0.62, which is amazing if one considers that one of the arguments for keeping the flag in the first place was that old people had become accustomed to it over many years of living under it.
For their part, the young preferred to keep the flag. The correlation between being in the 15-19 age bracket and voting to change the flag was -0.53.
Some might find these latter points extremely interesting, because they support anecdotal evidence from overseas suggesting that the generation to follow the Millenials – those who some have dubbed Generation Z – are more conservative than their immediate predecessors.
This question will be revisited in the second edition of this book, to be written after the 2017 General Election!
*
This article is an excerpt from Understanding New Zealand, by Dan McGlashan, published by VJM Publishing in the winter of 2017.