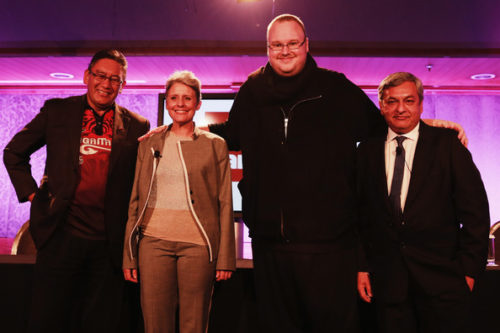
Understanding New Zealand: Conservative Party Voters

The Conservatives are a strange sort of movement. In many ways they appear to be some kind of rump movement of people who didn’t like it when National decided to move into the 21st century.

The strongest correlation between voting Conservative in 2014 and voting for another party in 2014 was with National – this was 0.77. This is strong enough to suggest that many Conservative voters would have been former National voters, or would have been severely tempted to vote National in 2014.

National was the only party to have a significant positive correlation with voting Conservative in 2014.

There were two parties that were close to uncorrelated. The correlation between voting Conservative in 2014 and voting New Zealand First in 2014 was 0.01, and with voting ACT it was 0.13.

The former of these is probably because both movements compete for the angry, scared old person vote, and the latter is probably because both movements share an indifference towards the poor.

Voting for any of the left-wing parties had significant negative correlations with voting for the Conservative Party in 2014, further emphasising the degree to which the Conservative movement appeals (and is intended to appeal) to disaffected National voters.

The correlation between voting Conservative in 2014 and voting Greens in 2014 was -0.42, and with voting Aotearoa Legalise Cannabis Party it was -0.54. This pair involved slightly weaker correlations than for the other three parties, primarily because Green and ALCP voters are closer to middle aged.

The correlation between voting Conservative in 2014 and voting for the Labour, Maori or Internet MANA parties were -0.63, -0.64 and -0.64 respectively.

Age is the main reason for the strong negative correlations between voting Conservative and any of these parties. The correlation between voting Conservative in 2014 and median age was 0.75, which means Conservative voters are almost as old as National voters.

Conservative voters are even more likely to be on the pension though. The correlation between voting Conservative in 2014 and being on the pension was 0.64, compared to a correlation of 0.50 between voting National in 2014 and being on the pension.

Conservatives are also less educated than average. Whereas the correlations for voting National in 2014 and having any of the university degrees were all positive and either significant or bordering on it, the correlations for voting Conservative in 2014 and having any of the university degrees were all negative and bordering on significant.

Females are less unlikely to vote Conservative than they are to vote National. The correlation between being female and voting Conservative in 2014 was -0.19, compared to a correlation of -0.35 between being female and voting National in 2014.

One major way the two differ is with respect to wealth. The average National voter is much wealthier than the average Conservative one. The correlation between net median income and voting Conservative in 2014 was only 0.06, compared to National’s 0.53.

In fact, looking at the correlations with income bands tells us that wealth is the major differentiator between Conservative and National voters.

The income band that had the strongest positive correlation with voting Conservative in 2014 was the $20-25K band, which was 0.17. All of the correlations between voting Conservative in 2014 and any income band above $25K were negative (although they were all very weakly correlated; not close to significant).

By contrast, all of the correlations between voting National in 2014 and any income band above $60K were positive and significant.

One of the largest differences was that with median family income. The correlation between median family income and voting National in 2014 was 0.42; for voting Conservative it was -0.08.

Oddly, although the average Conservative was more likely than the average National voter to be a Christian, these tended to belong to denominations that were less part of the establishment than the National voters.

The correlation between being a Christian and voting Conservative in 2014 was 0.37, compared to 0.29 for voting National in 2014.

Conservatives, though, were much more likely to belong to the Brethrens. The correlation between being a Brethren and voting Conservative in 2014 was 0.54, compared to 0.25 with voting National in 2014.

Conservatives were also much more likely to be Mormons, Jehovah’s Witnesses, Ratana, Pentecostalists or “Christian not otherwise defined” than National voters, who were more likely to be Anglicans, Presbytarians or Catholics.

Also, the average National voter is slightly less likely to be religious, whereas the average Conservative is slightly more likely to be religious.

The average Conservative is also less likely than the average National voter to be a Kiwi of European descent. The correlation between being of European descent and voting Conservative in 2014 was 0.46, compared to 0.60 between being of European descent and voting National in 2014.

All of this suggests that the main Conservative constituency is those who are like National Party voters in many demographic ways, but who do not have the same level of wealth or social status. It could even be that there is a degree of resentment among them because they are often both old and poor.

*

This article is an excerpt from Understanding New Zealand, by Dan McGlashan, published by VJM Publishing in the winter of 2017.

The West’s Weirdest Political Alliances

It is said that “politics makes for strange bedfellows”. Well, so does the sister industry to politics, prostitution. The major difference between politicians and prostitutes, as this essay will illuminate, is that there are things that prostitutes are too ashamed to do for money.

The Sanders-Clinton alliance was weird, but not especially weird by the standards that we have now degenerated to. It’s not especially surprising that a defeated social democratic candidate would endorse the more left-wing of the remaining two.

One truly weird one that has been going strong for over a century is the Marxist feminist – Christian fundamentalist anti-porn and prostitution alliance.

These two forces both have an immense hatred of natural sexual liberty. The Marxists want to destroy all natural sexual impulses and pervert them into worship of the state, whereas the Christians want to lay guilt trips on people for these same impulses and call them sinful.

For these reasons the two have combined against women.

This was never going to be a particularly strong alliance, though, for the reason that the Marxists want to promote all manner of sexual degeneracy in place of natural sexual relations, whereas the Christians want to suppress and repress everything, natural or otherwise.

Another unusual alliance is that of the various control freaks who oppose cannabis law reform.

This has seen the Police (who do not want to lose the power they have to control people or the funding given to them to do so) and the alcohol companies (whose product causes over half of the damage that the Police have to clean up) to get into bed with each other.

Here it is really the Police that have been cucked by business interests. Because alcohol and pharmaceutical companies see cannabis as a competing product, they have bribed the people that the Police answer to to make it illegal – and the men and women of the Police force pay the price.

The fact that this has resulted in making life immensely more difficult for the Police themselves, who have to face the carnage wrought by booze on a daily basis, appears to be completely lost on them – they continue to vocally oppose cannabis law reform.

Even weirder are the shifting anti-nationalist forces that have opposed Brexit, Trump and which now oppose Marine Le Pen.

This alliance has seen trendy liberals who consider themselves leftists coming out on the side of the political establishment (including the conservative parties), the international bankers, the corporate media and the unelected European Commission against the working class that the left supposedly exists to help.

This column has previously raised the possibility that these people may, in fact, be crypto-conservatives, and it’s certain that some are.

Most of them, though, are genuinely stupid enough to believe that they are acting in favour of the underdog and the unfortunate when they come out in support of the same globalist forces who have spent the past 30 years attacking the standard of living of the working classes.

The pro-Islam league of homosexuals, however, tops them all.

It appears that, because Muslims are generally considered outsiders in Western society, other groups who are also generally considered outsiders have decided to see Islam as a kindred spirit under the motto of “the enemy of my enemy is my friend.”

Unfortunately for the homosexuals, the Muslims they love and the Christians they hate are both Abrahamists, and as they are both male supremacist religions they share a common hatred of homosexuality.

Indeed, homosexual conduct is punishable by death in all of Afghanistan, Brunei, Gaza Strip, Iran, Iraq, Mauritania, Nigeria, Saudi Arabia, Sudan, United Arab Emirates and Yemen.

But thanks to a mutual hatred of The Man, homosexuals are frequently willing to passionately defend a religious tradition that would like to see them thrown from rooftops.

That has to be the West’s weirdest political alliance.

Understanding New Zealand: Demographics of Industry

Some stereotypes are true; others are not. One of those that is not true is that Maoris dominate all working-class industries. Although (as described elsewhere) many working-class industries and occupations are heavily populated by Maoris, this isn’t the full story.

The correlation between working in the agriculture, forestry and fishing industry and being of European descent (0.37) was stronger than the correlation between working in that industry and being Maori (0.22). Part of the reason for this is the number of family-run farms, especially on the South Island, that are run by Pakeha.

Working in the mining industry was also much more strongly correlated with being of European descent (0.25) than with being Maori (0.08). This is a consequence of that a large proportion of the Maori population lives in Auckland and thus far from where most of the mining takes place.

Being Maori did have significant positive correlations with a number of generally working-class industries, in particular transport, postal and warehousing (0.47), manufacturing (0.44), education and training (0.43), electricity, gas, water and waste services (0.42) and administrative and support services (0.37).

One point to note here is that these industries are not so much working class as they are people-focused. It might be that much of the association between being Maori and being working class is because many people-focused jobs happen to be working class ones and Maori gravitate towards people-focused jobs.

The correlations with median personal income give us a good indication of which industries in New Zealand are the best paid.

The strongest positive correlations between median personal income and working in a particular industry were 0.76 for professional, scientific and technical services, 0.69 for financial and insurance services, 0.54 for information media and telecommunications and 0.49 for rental, hiring and real estate services.

The strongest negative correlations between median personal income and working in a particular industry were -0.40 for manufacturing, -0.29 for transport, postal and warehousing, -0.23 for agriculture, forestry and fishing and -0.15 for mining.

The negative correlations were weaker than the positive ones for the reason that anyone in gainful employment – in any industry – is almost guaranteed to be wealthier than all beneficiaries and the majority of pensioners.

The correlations with education reflected that the highest paying industries were also the ones that generally required the greatest degree of previous training and therefore education.

The strongest of all was the correlation between working in scientific, technical and professional services and having a Master’s degree – this was 0.94. There is nothing suprising about this because often a Master’s degree minimum is necessary for a professional job.

The correlations between working in a particular industry and being born in New Zealand are interesting because they can tell us what sort of person is most likely to successfully get through our immigration system. Because our immigration system prioritises the sort of person who has a skill that New Zealand has a shortage of, these people will be disproportionately many in some industries.

Foremost of these was scientific, technical and professional services. The correlation between working in this industry and being born in New Zealand was -0.47, which tells us that a fair number of these workers have moved here from overseas.

The correlation between being born in New Zealand and working in financial and insurance services was even more strongly negative, at -0.56. The main reason for this is probably because the bulk of this industry in New Zealand is based in Auckland and that’s also where most foreign-born people are.

Many of the people who own their own farms work at home in a family business. This is evident from the strong positive correlation between working at home and working in the agriculture, fishing and forestry industries, which was 0.81, and the very strong positive correlation between working unpaid in the family business and working in the agriculture, fishing and forestry industries, which was 0.90.

One trend that makes sense if considered from an economic psychology perspective is that the better paid a person’s job is, the more likely they are to work full time.

The industries that had the strongest positive correlation with working full-time were professional, scientific and technical services (0.52), financial and insurance services (0.48) and information media and telecommunications (0.44).

There are several reasons for this, but the major one is that anyone of a mind to learn the skills necessary to do jobs in these industries are usually also of a mind to work full-time and to earn as much money as possible during this time.

The other major one is that anyone with the capital to employ a person with these skills is likely to be a serious operator and consequently will be looking to get full productivity out of their employees.

Perhaps the best way to determine which industries are the best paid are to see which of them have the strongest correlations with high income bands.

The industries that had the strongest correlations with low income bands were hospitality in the $5-10K band; mining in the $15-20K band; healthcare and social assistance in the $20-25K band; agriculture, forestry and fishing in the $25-30K band; electricity, gas, water and waste services in the $30-35K band; and manufacturing and transport, postal and warehousing in the $35-40K band.

These are the industries for people who are generally doing it hard. The jobs are not well paid, and they are insecure, and they are often seasonal. Usually they are also jobs that have a high turnover (hospitality is particularly well known for this).

Where jobs are more stable, regular and predictable, we can also see a rise in which income band their workers belong in.

The industries that had the strongest correlations with medium income bands were construction and retail trade in the $40-50K band; administrative and support services in the $50-60K band; education and training in the $60-70K band; and wholesale trade, public administration and safety and arts and recreation services in the $70-100K band.

Construction is arguably the top of the working class industries, because even though the majority of the labour is manual it involves very high amounts of capital. The other five industries in this group (leaving aside retail trade) are the start of the knowledge industries, in that they generally demand a higher level of prior education.

The industries that had the strongest correlations with the high income bands were information, media and telecommunications, finanical and insurance services and professional, scientific and technical services at $100-150K, and rental, hiring and real estate services at $150K+.

In other words, if a New Zealander works in any of these industries, the odds are that they have a six figure salary. This is because these industries all, like construction, involve gigantic amounts of capital, but unlike construction they are knowledge industries and the workers in these industries are in higher demand and shorter supply.

Rental, hiring and real estate services involves not only big money but employees that work on a commission and not a salary. This explains why working in this industry has its strongest correlation with the highest income band.

*

This article is an excerpt from Understanding New Zealand, by Dan McGlashan, published by VJM Publishing in the winter of 2017.

Understanding New Zealand: Demographics of Asian New Zealanders

The main reason why Asian immigration to New Zealand has been the polar opposite to Muslim immigration to Europe in terms of its success and how happy the locals are with it can be seen by the demographics of the group. In particular, the Asians moving here are considerably wealthier, better educated and more middle class – the sort of person that is most likely to make a positive contribution to those around them.

The demographics of Asian New Zealanders, like the voting patterns of this group, are primarily characterised by the fact that the majority are immigrants or descendents of relatively recent immigrants, and as such had to pass the relatively stringent points system.

For example, the correlation between being Asian and being born overseas is an extremely strong 0.91. This tells us that the vast majority of Asians living here were born overseas. The correlation between being Asian and being born in North East Asia was 0.87, but the correlation between being Asian and being born in the Pacific Islands was also fairly strong, at 0.51.

This tells us that, although the bulk of Asians in New Zealand are from China, Hong Kong, Taiwan, South Korea and Japan, there are also many South Asians, and even a fair number of Fijian Indians who are here.

The Asians that do come here certainly do so with higher educations (as mentioned above, this helps them pass the points system). The correlation between being Asian and having a university degree was 0.64 for a Bachelor’s, 0.41 for an Honours, 0.60 for a Master’s and 0.28 for a doctorate.

Interestingly, these figures are not especially indicative of higher earning. The correlation between being Asian and net median income was only 0.22, positive but not significant. This is curious considering that being Asian had a significant positive correlation with either of the two highest income bands: with $100-150K it was 0.32 and with $150K+ it was 0.28.

The reason for this might be that Asians, despite the stereotype of the Chinese slumlord, have not accumulated enough wealth to move into the rentier class yet – a class that is dominated by Kiwis of European descent and Maoris.

It may also be that Asians are much less likely than other Kiwis to live in a family where both parents are working, and that this lowers the average. Although the correlation between being Asian and earning $150K+ was 0.28, the correlation between being Asian and living in a family with an income of $150K+ was only 0.10.

There was a significant negative correlation between being Asian and living in a freehold house (-0.34) and a significant positive one between being Asian and living in a rented house (0.26). There is also a significant negative correlation between being Asian and being self-employed with employees (-0.31) and a significnat positive one between being Asian and working as a professional (0.37).

This group of correlations tells the story of Asians moving to New Zealand recently with professional educations and working professional jobs, but not having been here long enough to become old money and make investment income.

Correspondingly, there are strong correlations between being Asian and working in knowledge-intensive industries and none with either capital or labour-intensive industries.

The correlations between being Asian and working in a particular industry were 0.62 with financial and insurance services, 0.57 with wholesale trade, 0.50 with information media and telecommunications and 0.48 with professional, scientific and technical services.

That Asians tend to be middle-class can be seen from the positive correlation between being Asian and never having smoked tobacco: a very strong 0.77. As anyone who has been to Asia knows, this statistic is far from representative of the people who live there, which suggests that the sort of Asian that emigrates to New Zealand is a cut above their fellows.

The strongest correlation in this entire study – even stronger than the correlation between being Maori and voting Maori Party – is the correlation between being a Buddhist and an Asian – an immensely strong 0.95. This tells us that no matter how trendy Buddhism might be among certain Westerners in Nelson, Grey Lynn and Khandallah, the vast majority of New Zealand Buddhists are Asians who were born into it.

*

This article is an excerpt from Understanding New Zealand, by Dan McGlashan, published by VJM Publishing in the winter of 2017.