The First Rejection of alternative centrism is rejection of excessive order. The First Rejection is the contention that excessive order leads to stagnation.
Order may be the basis of civilisation, as per the First Acceptance. But an excess of it is suffocating. Too much order calcifies the institutions that make up society and petrifies the central bureaucracy. It makes people brittle. This brittleness, as Lao Tzu warned, leads one to break instead of bend. Thus, an excess of order will destroy a society unless pre-empted by the revolutionary action of those suffocated by it. As a result, it is rejected in the First Rejection.
In history, excessively rigid societies tend to get shattered by more fluid ones. The Greeks under Alexander and the British in India and China both defeated much larger empires which had succumbed to stagnation. The same order that makes a polity strong makes it weak when pushed to excess. The First Rejection of Alternative Centrism is a rejection of that stagnation that leads to weakness.
The Dark Ages is the best historical example of excessive order. The Christian authoritarians responsible for the Dark Ages took control at the end of the 4th Century, and imposed an entirely new order. Instead of religious and philosophical freedom, there would now only be dogma. Free-thinkers, like Hypatia, were murdered. Books were banned. All truths could be found in the Bible – if it wasn’t in the Bible, you didn’t need to know it.
After 1,200 or so years of this order, Europeans had forgotten that the Earth rotates around the Sun. Aristarchus of Samos, born in 310 BCE, was the first man to present a heliocentric model of the Solar System. Almost two millennia later, Giordano Bruno was burned at the stake for promulgating much the same truth. It’s hard to believe, but it’s true: Europeans actually went backwards in the 1,900 years between 300 BCE and 1600 CE.
Stagnating so hard that one comes to forget basic science is a typical example of what inspires the First Rejection. To stagnate that hard is to die in spirit. It’s to live only as a zombie, a mockery of life. This stagnation is what makes young people angry, and what makes them burn down things. To that extent, it’s usually old people supporting the Establishment Right, and the younger generations eventually get sick of them lingering.
Notably, many of those in the Establishment Right will see the Dark Ages as a high point in European history. They see the stagnation as a time of peace and stability. The Feudal Era is another time that the Establishment Right looks back to fondly, being a time of great order. Everyone knew their place – from the king right down to the lowliest peasant. Most pleasing of all, this order was hardly ever challenged. There was the odd peasant’s revolt but they were usually put down quickly by the armoured knights.

The two main powers of the Feudal Era – the monarchy and the clergy – comprise the two main factions of the Establishment Right today. The monarchy represents how order is established over people physically; the clergy represents how order is established over people non-physically. This is why wealthy families during the Feudal Era sent their spare offspring into the clergy and the military – those offspring would then uphold the order of things.
In the 21st Century, the monarchy and the clergy are still the main factions of the Establishment Right. The monarchy’s biggest supporters are the Army and the Police, which are well-known for being conservative institutions. Even in America, which has no monarchy, Army and Police personnel support the idea of one more than anyone else. The clergy still has power because they own enormous amounts of land, and because people still willingly take moral and spiritual guidance from them.
This feudal system worked reasonably well back in the day, but for one fatal flaw – it was prone to stagnation.
A capacity for merit in human beings is mostly inherited – but it’s not inherited directly from the parents. It’s actually inherited from the ancestors through the parents. This is why children are not just mere clones of their parents, but are throwbacks to older generations in many ways. This is also why there is so much variation in merit within families and groups of families. Meritorious men have ordinary sons, and vice-versa, all the time.
The main problem with the Establishment Right is that it will demand that a talented or meritorious man of low birth submit to a mediocre man of high birth for the sake of order. This is the main way that it generates resentment. Although this is the most orderly way to run things, it’s not easy to get the talented and meritorious men to accept it. Invariably those men realise they could do a better job of running things than those who inherited the positions. And then one finds the presence of revolutionary sentiments.
The Establishment Right has been aware, since the beginning of history, that their natural enemy is the high thumos man of low birth. Such men are represented by Lucifer in Jewish mythology. In this mythology, Lucifer was commanded by Yahweh to submit to Adam, because Yahweh’s whims at the time favoured his most recent creation. Lucifer was unwilling to do so, and was cast into disfavour. This story is a lesson to the Establishment Right: the plebs are supposed to obey even your most arbitrary commands. Those not willing to do so are the enemies of order.
“Chesterton’s Fence” is the archetypal example of reasoning that leads to excessive order. The logic of Chesterton’s Fence is that nothing should be changed unless one understands exactly why it is the way it is. But because nothing is ever fully understood – especially not matters of history – this is effectively an argument to change nothing ever.
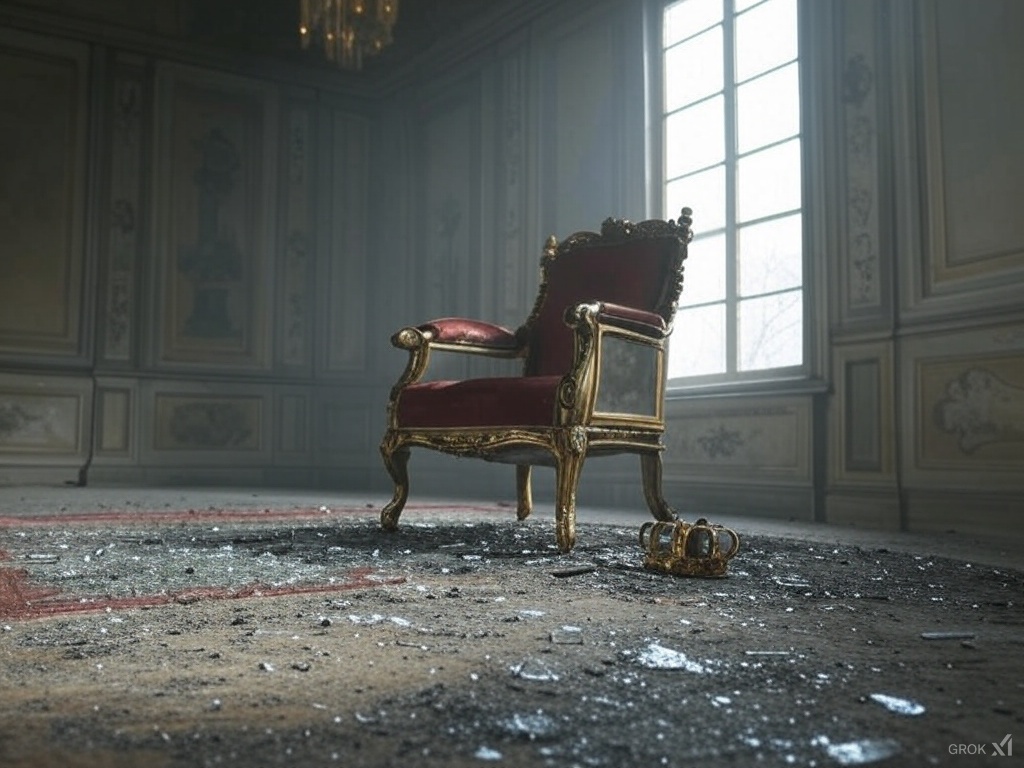
G.K. Chesterton also gave us other ideas popular with the Establishment Right, such as the idea that “tradition is the democracy of the dead”. Every declining power makes this same argument in order to cling to the throne a bit longer. In making the First Rejection, the alternative centrist says: tradition for its own sake is the virtue of the stagnant.
The Establishment Right has a very particular view of history, in which the status quo is always right. They tend to blame the Wars of Reformation on the Protestants, for example. If only they had kept submitting to the established order, there would have been no problems. These unrelenting demands for submission only increase the frustration that younger generations feel at the stagnation of their societies. Asserting the moral primacy of order becomes ever-harder the more a society stagnates. The First Rejection, then, rises with revolutionary forces: with the young, the vital, the courageous, perhaps also the idealistic and naive.
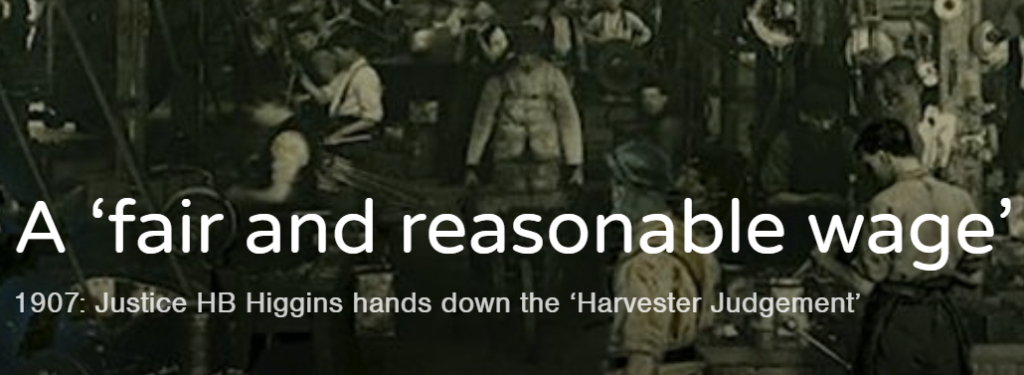
For all the above reasons, anti-Establishment Right movements are generally also anti-stagnation movements, i.e. freedom movements. Perhaps the most effective one since World War II was the anti-landlord campaign carried out by Chairman Mao (landlording being a major cause of economic stagnation). The antipathy towards the Establishment Right in 2025 is mostly a result of several decades of net zero wage growth.
The fatal flaw in the attitude of the Establishment Right is that they have little interest in the concept of freedom, which presages the Second Acceptance.
*
This chapter is from The Alternative Centrist Manifesto, the book that offers the answers to the political problems of the West.
*
For more of VJM’s ideas, see his work on other platforms!
For even more of VJM’s ideas, buy one of his books!
*
If you would like to support our work in other ways, make a donation to our Paypal! Even better, buy any one of our books!