Who Voted for the Ban 1080 Party?

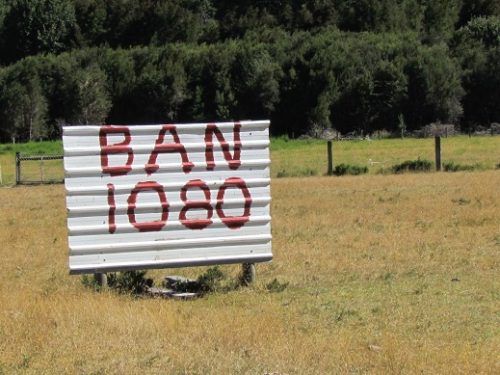
Of all the smaller parties in the 2017 election, the Ban 1080 Party might be the strangest of them. There are other small single-issue parties – the Aotearoa Legalise Cannabis Party being foremost of these – but even these other parties have equivalents overseas. Who are the Ban 1080 Party, and what do we know about their 3,005 voters?

The Ban 1080 Party website argues for the need to stop making aerial poison drops that use sodium monofluoroacetate (1080) in New Zealand’s national parks and forests. The website’s tagline is “Protect our native birds” and they believe that aerial 1080 drops are a risk to the wellbeing of New Zealand’s birdlife.

A strong South Island focus was evident from the correlation matrix – the correlation between voting Ban 1080 Party in 2017 and living on the South Island was 0.37. The reason for this is probably because a greater proportion of South Islanders will live in the vicinity of a national park or a forest than North Islanders, who are much more urban on the whole, and it’s these people who access the outdoors who are most concerned about things like aerial poison drops.

This explain why the Ban 1080 Party also correlates strongly with other demographics that are well-represented on the South Island. The correlations between voting Ban 1080 in 2017 and other demographic categories were 0.34 for being a Kiwi of European descent, and 0.22 with median age. The only age bracket with a significant positive correlation with voting for the Ban 1080 Party was the 50-64 age bracket – the correlation here was 0.38.

If we examine measures of class we can see that Ban 1080 Party voters are poorer and less educated than the national average, which is especially striking if one considers that they otherwise belong to demographics that are positively correlated with wealth.

The correlation between voting Ban 1080 Party in 2017 and median personal income was -0.23, and the correlation between voting Ban 1080 Party in 2017 and having no NZQA qualifications was 0.44. Related to this is a correlation of 0.30 between voting Ban 1080 Party in 2017 and being a regular tobacco smoker. This paints a picture of a section of the community who are relatively simple people and who perhaps have been taken in by the hysteria a bit.

The rural nature of Ban 1080 Party voters is demonstrated starkly when it comes to the correlations between voting for them in 2017 and working in the agriculture, fishing and forestry (0.67) or mining (0.69) industries. There was also a significant positive correlation of 0.35 between voting for Ban 1080 Party in 2017 and working in the hospitality industry.

These three correlations reflect the high proportion of Ban 1080 Party voters who were enrolled in either the West Coast-Tasman or Clutha-Southland electorates.

Underlying that Ban 1080 Party voters are comprised of the outdoorsy kind of person who spends a lot of time in national parks and forests, there are significant positive correlations between voting Ban 1080 Party in 2017 and both being born in New Zealand (0.46) and being male (0.35).

Ironically, given their heavy conservation focus, the Ban 1080 Party does not attract followers who are like the Green followers. The correlation between voting Ban 1080 Party in 2017 and voting Green in 2017 was -0.09.

People who voted Ban 1080 Party tended to overlap with those who voted New Zealand First and, oddly, Aotearoa Legalise Cannabis Party. Voting for the Ban 1080 Party in 2017 had a positive correlation with voting for either of these parties: 0.41 for New Zealand First and 0.28 for the ALCP.

Part of the reason for this is the high level of Maori support for the party. This might sound contradictory, given that most Maoris live on the North Island, but a couple of statistics make this association clear. The first is the correlation between voting Ban 1080 Party and being Maori, which was 0.16, and the correlation between living on the South Island and being Maori, which was -0.26.

This tells us that South Island Maori were proportionately big supporters of the Ban 1080 Party, which is fitting considering that this demographic is extremely active in the outdoors with hunting and food gathering.

How to Not Sound Crazy When Talking About Your Psychedelic Experiences

It’s hard to talk about the world beyond to people who aren’t familiar with that range of frequencies

Even though the Internet has led to a sharing of shamanic knowledge completely unprecedented (and impossible) for any other point in the world’s history, it hasn’t filtered down to the mass consciousness yet. Probably it never will – the men of silver and iron and clay cannot be expected to concern themselves with what lies beyond this veil. This essay gives some tips for talking to them about the world beyond without sounding insane.

The most important thing is to have a feel for what the person you are talking to is likely to be able to handle. This means that you have to look for clues from what you already know about them to give hints about what they already believe.

The easiest way to sound crazy is to express a belief that does not accord with consensual reality of the mass consciousness of the people around you. This is true whether you are in meatspace or cyberspace. The lower the intelligence of the person you are speaking to, the less likely it is that they will have challenged any belief widely-held by the people around them.

It is in this will to challenge consensual reality that most people judge sane from insane. All you have to do is to assert that things are not as they are commonly believed to be, and some people will start to consider you crazy. Essentially you only have to contradict the television, or in other cases the radio or FaceBook.

You might start a conversation with a suspected normie by questioning the narrative that you are fed by the network news, or by the broadsheet papers. Even that is enough to sound pretty crazy to most people, who are on the level of “they couldn’t say it if it wasn’t true.” If a person is on this level they are in no way ready to handle the idea that the government has lied to them about psychedelics for the sake of making them easier to control.

A useful tactic here is to point out how the governments and mainstream media of Anglosphere countries colluded to sell the lie that Saddam Hussein had weapons of mass destruction in order to manufacture consent for the Iraq War. It’s possible now, though, that a person remembers those times differently and will choose to remember it in a way that denies this collusion.

It pays to be wary of the fact that most people are materialists, which implies that they believe that the brain generates consciousness, and that upon the death of the physical body this consciousness somehow “disappears”. These people consider all kinds of religious ideas like karma and God to be superstitions, and the bitterest contempt is reserved for those religious who believe that the consciousness survives the death of the physical body.

Unfortunately, this belief is also one of the major insights of psychedelics – perhaps it is this psychedelic insight that forms the foundation of most religious beliefs.

Psychedelics are hard, and integrating their lessons extremely hard

Mathematics is the way to get at people who are the hardest to reach. Expressing a sense of awe and wonder at how, for example, the Fibonacci sequence reoccurs in the state of Nature is a good way of getting a person to ask themselves whether there’s something other than sheer chance going on. Other ways are to express similar sentiments about the non-reoccurring nature of pi or the import of Goedel’s Incompleteness Theorem.

The way to talk about it so that it makes sense is by talking about previous beliefs that you once held that you either questioned or abandoned after taking a psychedelic. Usually this makes it possible to apply logic to dismantle one erroneous idea after the other, and it’s seldom necessary to mention that this destruction of illusion was achieved by means of psychedelics (any insight that psychedelics have brought you can be plausibly credited to either meditation or a near death experience as well).

For example, a psychedelicised person might be able to conduct a conversation with a normie about the boundaries of the human body, and how it’s not clear where inside ends and where outside begins. The very idea of selfishness starts to unravel if the idea of what it is that one might be selfish about is challenged, and by such means light can shine through.

This column believes that the ultimate goal of consciousness expansion is apotheosis, where an individual consciousness reunites themselves with the universal consciousness and becomes privy to certain mysteries, such as that there is no such thing as time and that the death of the physical body does not impact the true self.

Contemplation of this alone is liable to induce a psychiatric breakdown in a lot of people. Most people are so utterly terrified of the concept of their future death that they have pushed the very idea of it into a deep, dark part of the mind, only to be ventured into in an emergency. Even fewer people have looked deeply enough into their own minds to have made a surgically precise distinction between consciousness and the content of consciousness.

Starting with such subjects is probably too much. Most people will declare you crazy for talking about them rather than risk psychosis by dwelling on them.

Questioning the materialist dogma that the brain generates consciousness is the quickest way to be seen as crazy. This dogma is taken by many to be the absolute, inviolable and axiomatic truth of reality and conversation along these lines is likely to make materialists fear or despise you.

The best thing is probably to declare skepticism of the claims of a mutual enemy. The Government, the Church or Big Business can all serve as excellent mutual enemies. Skepticism of the claims of these mutual enemies might then be generalised into skepticism about other claims and dogmas.

Who Voted New Zealand First in 2017

New Zealand First voters are generally drawn from the hard-done-by segments of the population

A previous article in this column examined the differences between New Zealand First voters and the voters of both National and Labour. It turns out that New Zealand First is almost equidistant from the two major parties if measured demographically. This article, however, looks more closely at who voted for New Zealand First in particular.

Despite being considerably whiter than it was in 2014, New Zealand First is not a particularly white party. In 2014 there was a correlation of 0.00 between voting New Zealand First and being a Kiwi of European descent. By 2017 this had climbed to 0.21, which was still not significant.

The strongest correlation between being of a particular ethnicity and voting New Zealand First was with being Maori, which was 0.38. The correlations between voting New Zealand First in 2017 and being a Pacific Islander (-0.21) or being Asian (-0.52) were much more negative.

Tellingly, for a nationalist party, their strongest support was from Maoris, who have the strongest roots in the country as essentially none of them are immigrants. Their next strongest level of support was from Kiwis of European descent, who have the second-deepest roots in the country, and their weakest level of support was from Asians, who have the shallowest.

As in 2014, New Zealand First voters in 2017 were some of the least educated out of any voting bloc. The correlation between having no NZQA qualifications and voting New Zealand First in 2017 was 0.67, and the correlation between having a doctorate and voting New Zealand First in 2017 was -0.60. This tells us that New Zealand First voters are decidedly working-class.

True to stereotype, there was a strong positive correlation of 0.58 between voting New Zealand First in 2017 and being on the pension, but there was also a strong positive correlation of 0.47 between voting New Zealand First in 2017 and being on the invalid’s benefit.

All of this suggests that the easy story of New Zealand First being an old racist’s party is somewhat misguided – it’s true that they do get many votes from poorly educated old white people, but that’s more because New Zealand First gets a lot of votes from hard-done-by people in general and poorly educated old people tend to be limited to their pension and therefore hard-done-by.

Gareth Morgan’s personal antipathy towards Winston Peters was reflected in the correlation of -0.31 between voting The Opportunities Party in 2017 and voting New Zealand First in 2017. This put TOP in a band with United Future (-0.27), ACT (-0.34) and the Greens (-0.48) as parties whose voters did not correlate highly in a general demographic sense with the voters of New Zealand First.

All four of those parties are particularly Pakeha-heavy parties, and ACT, the Greens and TOP appealed heavily both to young and educated people. So there is plenty of reason for these reasonably strong negative correlations.

There were positive correlations between voting New Zealand First in 2017 and voting for any of the Maori-heavy parties in 2017. These were Maori Party (0.11), MANA (0.24) and Aotearoa Legalise Cannabis Party (0.40).

Many will be surprised that there is a moderately strong positive correlation between voting New Zealand First in 2017 and voting Conservative Party in 2017 – this was 0.38. The reason for this is that both parties appeal to the large faction of poorly-educated old white voters mentioned above.

Despite the shared appeal to old white people, however, the correlation between voting National in 2017 and voting New Zealand First in 2017 was only 0.04, far from being significant. The reason for this is the class difference – the National Party appeals to people who are doing well economically (and most of these people are old), whereas New Zealand First appeals to people at the bottom of the ladder (and poor old people with no realistic way of becoming wealthier are definitely near the bottom).

*

This article is an excerpt from the 2nd Edition of Understanding New Zealand, which Dan McGlashan and VJM Publishing will have ready for sale at the end of October 2017. This will contain statistics calculated according to the official final vote counts and will be freshly updated with data from the 2017 General Election.

Who Voted Greens in 2017

The Green Party tore itself to pieces during this year’s electoral campaign, but a hard core of voters stayed with the party

The Green Party vote collapsed from 2014, as a previous article has examined, with much of it going to The Opportunities Party. Although the special votes helped them out since the time that linked article was written, they still fell to 6.27% in 2017 from 10.70% in 2014. This article looks at who voted for them.

The major curiosity about the Greens and their movement is that, although they are on the left, they are comprised of people who do not immediately benefit from increased resource distribution (i.e. the wealthy). The correlation between voting Greens in 2017 and median personal income was 0.36, which was up from 0.31 in 2014, and not a whole lot weaker than the correlation of 0.49 between median personal income and voting National in 2017.

All of the correlations between voting Green and being in one of the income bands below $70K were weak no matter if they were positive or negative. But above this point, the correlations were strong. Between voting Green in 2017 and earning $70-100K the correlation was 0.49, with earning $100-150K it was 0.56, and with earning $150K+ it was 0.51.

However, much like 2014, the average Green voter in 2017 was a bit younger than the average Kiwi. The correlation between voting Green in 2017 and median age was -0.18. This is mostly because of a very strong correlation of 0.60 between being aged 20-29 and voting Green in 2017.

The Greens lost ground with Kiwis of European descent. By 2017 the correlation between voting Green and being a Kiwi of European descent was 0.17, down from 0.24 in 2014, which meant that although it was still positive it was no longer significantly so. They also lost ground with Maoris. The correlation between being Maori and voting Green was -0.09 in 2014 but -0.14 by 2017.

By 2014, the Greens were already much better educated than the average Kiwi, and by 2017 this distinction had only strengthened. The correlation between voting Green in 2017 and having a university degree was 0.64 for having a Bachelor’s, 0.81 for having an Honours, 0.71 for having a Master’s and 0.68 for having a doctorate. This higher general education explains why Green voters can be above average in income despite being below average in age.

The Greens maintained their core, urban elite vote despite the losses from 2014, and this is evident from looking at the voting patterns of certain industries. The correlation between voting Green and working in information media and telecommunications was 0.75, with working in professional and scientific services it was 0.70, and with working in arts and recreation services it was 0.69. All three of those correlations were as strong or stronger in 2017 than they were in 2014.

Things were much different for voters in working-class industries. In 2017 the negative correlations between voting Green and working in a particular industry included -0.02 in retail trade (down from 0.09), -0.20 in construction (down from -0.09), -0.29 in agriculture, forestry and fishing (down from -0.24), -0.32 in transport, postal and warehousing (down from -0.29) and -0.56 in manufacturing (down from 0.49).

A couple of correlations that Green Party thinkers won’t be at all happy about, given their pretensions to being a party that represents the poor and downtrodden, are the moderate negative ones between voting Green in 2017 and being a machinery operator and driver (-0.47), labourer (-0.31) or as a technician or trades workers (-0.25). These occupations are dominated by Maoris who tend to have pro-Labour and pro-New Zealand First sentiments.

Green voters had little in common with the voters of any other party except for The Opportunities Party. Lending further evidence to the suggestion that TOP primarily took votes away from the Greens is the fact that the correlation between voting TOP in 2017 and voting Greens in 2017 was 0.77.

None of the correlations between voting Green in 2017 and voting for the parties that did get into Parliament were significant, except for the case of New Zealand First, which was significantly negative. These were 0.17 with ACT, 0.11 with Labour, -0.25 with National and -0.48 with New Zealand First.

It might seem strange that Green Party voters have a stronger correlation with ACT Party voters than with Labour Party ones. That’s not really so strange if one considers that on measures such as age, education, income and ethnicity, the two parties are reasonably similar (i.e. young, well-educated, rich, white and urban).

In a sense, it can be said that the Labour-National dichotomy is the dilemma the average Kiwi voter is faced with, but the ACT-Green dilemma is the one that the average ambitious, professional young Kiwi voter is faced with.

*

This article is an excerpt from the 2nd Edition of Understanding New Zealand, which Dan McGlashan and VJM Publishing will have ready for sale at the end of October 2017. This will contain statistics calculated according to the official final vote counts and will be freshly updated with data from the 2017 General Election.