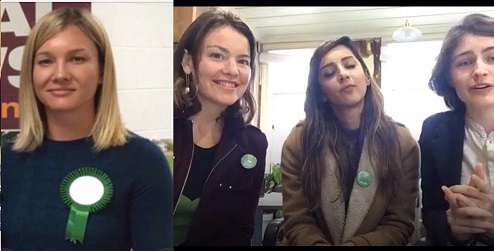
The Green Party vote collapsed at the 2017 General Election compared to 2014. They got 10.7% of the total party vote in 2014, but could only manage 5.9% in 2017 (although this may rise slightly on specials). This article looks at who abandoned them over the three years from 2014.
The largest, most immediate clue is that the average Green voter was much poorer this year than they were in 2014. The correlation between median personal income and voting Green in 2017 was 0.03, compared to 0.31 in 2014. This means that, from being about as wealthy as the average ACT voter, the average Green voter is now about as wealthy as the average Kiwi.
If we look at educational achievement and voting Green, there is evidence that the Greens were completely abandoned by the university-educated crowd.
The correlation between voting Green in 2017 and having a Bachelor’s degree was -0.09, with having an Honours degree it was -0.08, with having a Master’s degree it was -0.09 and with having a doctorate it was -0.08. These figures represent a drastic reversal of the strong positive correlations between voting Green in 2014 and having a Bachelor’s degree (0.57), an Honours degree (0.75), a Master’s degree (0.64) or a doctorate (0.67).
A further strong clue comes from looking at the voting patterns of professionals. Working as a professional and voting Green in 2014 had a very strong correlation of 0.73, but by 2017 this had collapsed, to -0.10. There was a corresponding collapse in the correlations between working in professional, scientific or technical services and voting Green – from 0.63 in 2014 to -0.09 in 2017.
As referenced in a previous article, the vast majority of these voters went to The Opportunities Party in 2017.
The other interesting change was that the Greens won a lot more working class Pacific Islander support than previously.
The correlation between being Maori and voting Green was virtually the same in 2017 (-0.08) as what it had been in 2014 (-0.09). However, the correlation between being a Pacific Islander and voting Green went from a significantly negative -0.27 in 2014 to an almost uncorrelated -0.07 in 2017.
It’s possible that the Greens won a lot of sympathy from working-class brown voters in the wake of middle New Zealand ripping into Metiria Turei during her WINZ scandal, but that the Maori half of those voters preferred Labour in the final analysis.
Essentially what these numbers suggest is that the Greens hemorrhaged the support of the professional class to TOP, but won the support of a fair number of working class Pacific Islanders who probably felt sympathy with Metiria Turei during her trial and execution by the mainstream media machine.
This explains how the Greens suddenly became a much more Christian party than they used to be. When they still got the support of the mostly atheist professional class, in 2014, the correlation between being Christian and voting Green was -0.57. In 2017, after being abandoned by this professional class and welcomed by working-class Pacific Islanders, who are frequently religious, the correlation between being Christian and voting Green had actually become positive, at 0.21.
That many of these new Green voters were Pacific Islanders can also be seen from the fact that industries with a high Pacific Islander workforce component tended to switch to them. The correlation between working in the postal, transport and warehousing industry and voting Green became markedly less negative, from -0.29 in 2014 to -0.01 in 2017, and there was a complete flip in the correlation between working in manufacturing and voting Green, from -0.49 in 2014 to 0.23 in 2017.
It could be that the Greens lost much of their forward-thinking professional class to TOP but, in doing so, flattened out their bias towards the wealthy and the educated and became more of a mass socialist party that found a voice among those at the bottom.
This theory is supported by the voting patterns of age in the 2017 election. In 2014, the correlation between voting Green and being aged 20-29 was strong, at 0.56. By 2017 it had fallen to -0.05. This collapse was the most brutal suffered by the Greens from 2014, and represents their total abandonment by the most trendy and fashionable segment of society.
Tellingly, the correlation between being aged 5-14 and voting Green increased sharply, from -0.42 in 2014 to -0.08 in 2017. Obviously, children cannot vote but this tells us that young adults who were yet to have children (that aspiring professional class) were heavily represented among those who left the Greens after 2014.
Some might be interested to note that the correlation between working for a wage or salary and voting Green dropped from 0.41 in 2014 to 0.10 in 2017. This more than anything shows the extent to which the Greens of 2017 represent the working-class brown family more than they do the professional white childless urban couple.
*
This article is an excerpt from the 2nd Edition of Understanding New Zealand, which Dan McGlashan and VJM Publishing will have ready for sale at the end of October 2017. This will contain statistics calculated according to the official final vote counts and will be freshly updated with data from the 2017 General Election.

Fascinating insights, but your photo caption…? It’s right out of Madmen. Would you have made the same comment about a party’s male candidates? This is actually 2017 folks.
How are these correlations calculated? Or rather from what data? With secret voting, I can’t understand how the information is available. It’s certainly fascinating (as one of the outliers, a rich university educated woman who voted Greens this time too!) but I want to understand this.
Prue, see explanation and link to electorate profile data here;
http://vjmpublishing.nz/?p=3346