Estimating the Electoral Impact of the Greens’ New Cannabis Policy

The Greens have taken their sweet time in updating their cannabis policy to something reasonable, and this newspaper has not shied from criticising them for dragging their heels. But today they did update it – and this update has electoral ramifications worth considering.

The updated drug law policy seems to be the responsibility of Julie Anne Genter (whose sponsored FaceBook posts you may have seen recently if you were in enough cannabis-related groups). This is her first major effort since assuming the role of Greens Health Spokesperson from Kevin Hague.

Most encouragingly, in an interview about the new policy Genter made a reference to Canada and the USA, in particular the Western seaboard closest to New Zealand. It’s in Colorado, Washington, Oregon and California that cannabis prohibition was repealed by referendum and in Canada that it is in the process of being repealed by a party that ran explicitly on the issue in a General Election.

She also used a couple of arguments straight out of the Cannabis Activist’s Handbook: that cannabis law reform was a similar sort of deal to gay marriage in that the herd was against until until it had had a few decades to think about it and that legalisation would make it harder – not easier, as it is considered by some – for young people to get hold of it because of the current lack of ID checks on the black market.

The Aotearoa Legalise Cannabis Party has made a point of using the example of Colorado to suggest what a sane cannabis policy ought to look like. So if the Greens are signalling that this is also their long-term vision, then they ought to count on collecting votes from people who think along similar lines.

The ALCP scored 0.46% of the vote in the 2014 General Election. This isn’t much but it’s a lower limit on what the Greens might expect to gain from this policy.

All of these people were willing to drag themselves to the polls to vote for a party who had no realistic chance of making a difference but who did intend to make noise about the cannabis law, so it’s likely that the vast majority of people willing to vote for the non-Parliamentary ALCP would be willing to vote Green now that the Greens have a similar cannabis policy.

This newspaper estimated last year that the true amount of support for the ALCP was probably closer to 1%, based on the increase in support for reform to New Zealand’s drug laws since 2014 (change has been very rapid on this front). The Greens can count on most of those.

On top of that, one has to factor in all the people who would have voted for such a policy in 2014 had a major party supported it, as one now does.

These people are probably as least three times as numerous as those who voted ALCP in 2014 or were intending to do in 2017.

It’s interesting to note that voting Green in 2014 and voting ALCP in 2014 has a correlation of only 0.02. This is because Green voters tend to be white and wealthy whereas ALCP voters tend to be poor and Maori.

Voting ALCP in 2014 had a correlation of -0.40 with Net Personal Income, which suggests that cannabis voters are poorer than all but Labour, Maori Party and New Zealand First voters. Voting Green in 2014 had a correlation of 0.31 with Net Personal Income, which means Green voters are almost wealthier than average by as much as the average cannabis voter is poorer than average.

Implicit in these statistics is the potential for the Greens to attract a large number of new voters, especially those who didn’t vote in 2014, as the anti-cannabis brainwashing has been least effective on those who are already disenfranchised, such as Maori, young people and the mentally ill, and these traditionally low-voting groups now have a reason to reconsider.

These statistics suggest that there are many New Zealanders who have only just now started to hear the Green Party tune as the party seeks to expand outside of their traditional wealthy, white urban strongholds.

It’s easily possible that this new policy will result in 2% extra votes for the Greens on Election night 2017, because of the immense degree of disenfranchisement suffered by cannabis users before today. This alone would result in two extra seats once they were all dealt out.

After all, there are 400,000 cannabis users in New Zealand and our options, until today, were terrible.

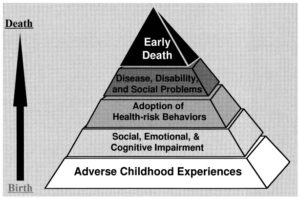
How the Actions of the John Key Government Contributed to NZ’s Record Suicide Rate

earlydeath

This year has been our generation’s equivalent of 1968 – changes on all fronts, and many records broken. Apart from breaking records at rugby, New Zealanders have also had recent success in breaking records at suicide.

Broadly speaking, we have some idea why people commit suicide. Although the biochemical reasons vary, the essential reason is a sustained abuse and/or neglect that convinces them it would be better to be dead than continue to live in a place where such things happen.

There is already evidence suggesting up to 90% of suicides occur in people with a mental health diagnosis or potential diagnosis, and an American study found that high rates of childhood abuse and neglect were correlated with a 12-fold increase in the frequency of suicide attempts as an adult.

Thus, it’s fair to say that – if it wasn’t already obvious to the reader – of those who attempt suicide as an adult, most will have a story of childhood abuse or neglect to tell.

What causes childhood abuse and neglect? Tragically, the answer to this is usually more childhood abuse and neglect; the child learns from its own parents that human life isn’t worth very much and naturally they treat their own children the same way. Monkey see, monkey do. Lack of empathy cascades down the generations.

Apart from this simplistic response, the strongest correlate with abuse and neglect of children is poverty. Poverty tends to lead to abuse and neglect for two reasons. The first is stress in the family unit, the second is that it causes mental illness in the mother.

Stress leads to abuse and neglect because a parent who is continually under high levels of stress will have greater difficulty maintaining the correct attitude towards their offspring. They are more likely to lash out from suppressed frustration and rage, and they are more likely to abandon consciousness through the bottle or other recreational drugs.

It might be obvious that mental illness in the mother contributes to an increased suicide rate among the offspring, but in case it isn’t obvious the science makes clear that such a causal relationship exists.

One of the most reliable factors predicting a future maltreatment report for any given child is known to be maternal depression.

It’s well known that poverty is one of the major causes of depression in women, usually because it imposes considerable psychological stress at the same time as removing women from accessing useful avenues of social support.

In fact the association between poverty and mental health is considered one of the most well-established in all of psychiatry.

For women it is especially acute because women tend to make much greater use of social networks to pre-empt mental health conditions. This means that poverty, in addition to the stress it already causes, makes it more difficult for women to maintain their social networks, and so an unfortunate feedback loop with poverty and decreased mental health outcomes can be observed.

Considering that the vast majority of people who are both poor and with dependent children are women, this pattern is especially impactful.

After reading all this, it is perhaps predictable that there is a relationship between childhood poverty and antisocial behaviour. Not only are children more likely to exhibit antisocial behaviour if they are from a home in poverty, but they are also more likely to show persistent patterns of antisocial behaviour into adulthood the more years that they spend in poverty.

All of this ultimately reflects an area where politics and health cross.

For, if poverty creates mental illness, then there’s a clear moral imperative to reduce poverty in the same way that there is a clear moral imperative to provide sanitation to people so as to prevent cholera outbreaks, typhus, plagues etc.

After all, in the same way that someone chucking a bucket of shit out into the street might impact you by creating a disease, childhood neglect and abuse is going to create the sort of adult that will rob, rape, burgle and murder you when you’re old.

However, a vote for the National Government of the past eight years was to vote for tax cuts in exchange for defunding rape crisis centres, slashing mental health funding, cutting benefits to sick people and perpetuating the war on drugs.

Looked at like this, it’s hard to deny that a vote for a National Government is a vote to decrease the mental health of everyone in the bottom half of society (or perhaps even bottom three-quarters, considering that many people vastly overestimate how wealthy they will be in ten years’ time), because it is a vote to redistribute wealth upwards from the already poor to the rich, thus increasing poverty and therefore the consequences of poverty, such as mental illness.

This might explain why so many old people vote National (the correlation between voting National in the 2014 General Election and Age is 0.81): they won’t be around to see the full extent of the damage that National policies do to the collective health of the nation, but they can cash in their tax cuts straight away.

Probably if John Key were to be presented with the information in this article he’d say that all mental health problems are caused by drug abuse. So there is little value in trying to talk sense to the current political establishment about the subject.

Perhaps the best thing to do is to educate the younger generations with the truth about how the bulk of psychological problems arose in our society, so that they’ll be in a position to do something about it when the grip of the Baby Boomers on the brass ring of power is relinquished in death.

Understanding New Zealand: Voting New Zealand First

winston

The New Zealand First Party has been around for over 20 years and has carved a reputation as a nationalist socialist party that caters especially to the old. Although this is somewhat true it is a simplicity that comes nowhere close to giving the full picture of what is arguably New Zealand’s third largest political movement.

The statistic that will surprise many is that there is no correlation at all between voting New Zealand First in 2014 and being of European descent. This value is an even 0.00, which gives the lie to the commonly-held belief that New Zealand First appeals heavily to white nationalist sentiments. In fact, the correlation between being Maori and voting New Zealand First is a strong 0.66, which tells us that Winston Peters’s party has a much stronger appeal to the tangata whenua than it does to the culture of the settlers.

This correlation can be easily observed without any complicated analysis: one need simply note the high percentage of New Zealand First support in the Maori electorates.

Although the statistics downplay the idea that New Zealand First appeals to racist sentiments, they certainly do not have much support among Asians – the correlation between voting New Zealand First and being Asian is -0.60. For being a Pacific Islander the correlation is -0.08, which suggests that Islanders are generally indifferent to Peters’s message.

Another surprising statistic is that there is no significant correlation between Median Age and voting New Zealand First (-0.08). So the idea that New Zealand First is a pensioners’ party also is a banal simplification. Indeed, the average New Zealand First voter is not much older than the average Green voter (for whom the correlation with Median Age is -0.17). Certainly much younger than the average National voter, for whom the correlation with Median Age was a very strong 0.81.

New Zealand First voters are the poorest of the supporters of any major party: voting for them has a correlation of -0.59 with Net Personal Income. They are also the most poorly educated. There is a correlation of 0.79 with voting New Zealand First and having no qualifications, which suggests a surprising working-class sentiment among their voters.

Indeed, as the New Zealand working class, especially those with no qualifications, are the primary losers from mass immigration, which sees their niche in the job market swamped with competition at the same time their rents skyrocket, it is not surprising they vote New Zealand First in great numbers.

Voting New Zealand First had a correlation of -0.41 with voting to change the flag in the second flag referendum, which might reflect monarchist sentiments, or perhaps a working class conservative streak. It could also reflect a distaste among New Zealand First supporters for the flagship project of an international banker who sold assets and opened the borders.

Supporting the idea that New Zealand First has a strong working class base, voting for them has a correlation of 0.40 with not voting at all, suggesting a significant degree of disenfranchisement. This is, however, not as strong as the correlation between voting Labour and not voting (0.67). Perhaps this is evidence of a higher level of political engagement among New Zealand First supporters compared to people in similar sociodemographics. This might reflect a higher level of political sophistication among New Zealand First supporters in comparison to those who support Labour.

Of interest to potential post-2017 coalition options, voting New Zealand First had a correlation of -0.34 with voting National, -0.39 with voting Green and 0.11 with voting Labour. The strongest correlations were 0.44 with voting Internet MANA and 0.46 with voting for the Maori Party.

On the face of it, this suggests that a Labour-New Zealand First-Maori coalition might be the left’s best best after 2017. As the correlation between voting Labour and voting Maori Party is 0.41 this arrangement might well be most amenable to all sides. That New Zealand First voters have an apparent dislike for Green voters that is even stronger than their enmity for National voters suggests the current cozy assumption of a Labour-Greens-New Zealand First coalition post 2017 might be miscalculated.

Interestingly, voting New Zealand First had a correlation of 0.57 with voting for the Cannabis Party. Although this can be mostly explained by the common factor of Maori support, it probably also reflects a shared rejection of the mainstream media message (cannabis users and New Zealand First supporters tend to share an extreme skepticism of the mainstream media).

*

This article is an excerpt from Understanding New Zealand, by Dan McGlashan, published by VJM Publishing in the winter of 2017.

Understanding New Zealand: Wealth and Poverty

moneymoneymoney

This is the one correlation everyone knows. In fact, this might reflect the single most fundamental division in politics: the have-nots trying to get and the haves trying to keep. Kids at primary school figure out that rich kids are more likely to be conservative than poor ones, and nothing changes at adult level. So this article looks at correlates with Net Personal Income.

A vote for National has a moderate 0.53 correlation with Net Personal Income, whereas a vote for Labour is -0.51. These two are probably of the same magnitude because they reflect mainstream, everyday people rationally voting for what suits their economic interests (the rich for less sharing, the poor for more sharing).

Perhaps the most interesting is that the correlation between voting Conservative and Net Personal Income is an insignificant 0.06. The Conservative Party may have had a wealthy backer splashing the cash, but the sort of person who votes for them is much less big money than the average National Party voter. Possibly this reflects the degree to which religious fundamentalists were attracted by Craig’s righteous message – and religious fundamentalists are known for being uneducated and thus poor.

The correlation with ACT is 0.36, which is interesting because this is not as high as it is for National. This tells us that ACT voters are actually poorer than National voters – which goes against the stereotype of ACT being a party only for big business. They are, however, significantly more wealthy than average. This could reflect a voter base of young professionals who are doing well but lack the seniority for the really big money.

With voting New Zealand First the correlation with Net Personal Income is -0.59, which means that the average New Zealand First voter is even poorer than the average Labour one. This can be explained to a large degree by the fact that New Zealand First’s support base consists mostly of Maoris and of pensioners.

Voting for the Cannabis Party and Net Personal Income had a correlation of -0.40, which suggests that the average cannabis user, while hard done by, isn’t doing quite as bad as the average Labour or New Zealand First voter.

The correlation with voting for the Maori Party and Net Personal Income was -0.35. The fact that this is weaker than the correlation between being Maori and Net Personal Income (-0.48) suggests that the Maori Party attracts a relatively wealthy section of Maoridom.

It probably comes as no surprise to anyone that people of European descent are significantly wealthier than the average Kiwi – this had a correlation of 0.35 with Net Personal Income. Some might be surprised by the fact that this is a higher correlation than that of being Asian with Net Personal Income, at 0.22. This might reflect the fact that, although Asian immigrants often come here with a considerable amount of capital, their children usually end up the same kind of pleb as the rest of us.

Maoris are also much poorer than Pacific Islanders, which might surprise some. The correlation between Net Personal Income and being Maori is -0.48, whereas for Pacific Islanders it is -0.29. This might reflect the fact that a relatively higher proportion of Islanders have immigrated to New Zealand for full time work, and therefore a relatively lower proportion of them are students, children or beneficiaries.

Another correlation that will surprise no-one is that between having a Master’s degree and Net Personal Income (0.67). This was almost as strong, in the other direction, as having no qualification and Net Personal Income (-0.68). That the correlation between having a Master’s degree and Net Personal Income is stronger than with either voting National or being white underlines the value of an advanced education in an advanced post-industrial economy like New Zealand.

There is also a correlation of 0.27 between Net Personal Income and no religion. This probably reflects the fact that the religious are less likely to become educated and therefore will have less opportunity to trade their labour for high amounts of money. The correlation with being Christian was an insignificant -0.07, probably reflecting the degree to which Christianity is mainstream. The correlation with being Buddhist was 0.32, probably reflecting that immigrants from Buddhist cultures to New Zealand historically tended to be well-educated.

A statistic that will depress some and enthuse others is that the correlation between Net Personal Income and voting in the 2014 General Election is 0.52, which reflects the degree to which the poor are disenfranchised by politics in New Zealand (this correlation cannot be explained by age alone).

*

This article is an excerpt from Understanding New Zealand, by Dan McGlashan, published by VJM Publishing in the winter of 2017.