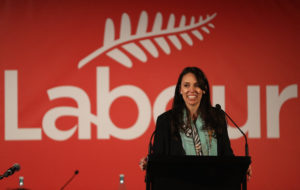
The Labour Party formed in opposition to the sort of capitalist interests that would later form the National Party. Predictably, then, voting for Labour in 2014 has a very strong negative correlation with voting for National in 2014 (-0.85), and a moderately strong negative correlation with median personal income (-0.51).
With no other party apart from the Conservatives (-0.63) do supporters of Labour differ from near as intensely. Voting for Labour in 2014 was not significantly correlated with any of voting Green (-0.03), voting New Zealand First (0.11) or ACT (-0.19). The only parties that had a significant correlation with voting Labour in 2014 were the ALCP (0.38), Internet MANA (0.41) and the Maori Party (0.41).
This latter point is mostly a function of the powerful racial divide between the two major parties. The correlation between voting Labour in 2014 and being of European descent is a whopping -0.76. With being of Pacific Islander descent it is even higher, but in the other direction: 0.78. This latter statistic, coupled with the fact that voting Labour in 2014 has a correlation of 0.42 with being Maori, suggests that Labour is actually a Polynesian party to a considerable degree.
The statistic that Labour Party leaders will rue more than any other is the correlation between voting Labour in 2014 and turnout rate in 2014, which was -0.67. This tells us immediately that any given Labour supporter is significantly less likely to actually cast a vote for their party, which brings to mind the saying “Left-wingers fall in love; right-wingers fall in line.”
A statistic that might surprise many is that the correlation betwen voting Labour in 2014 and having no religion is -0.50. Although this can mostly be explained by the fact that being of Pacific Island descent has a correlation of 0.46 with being a Christian, it also brings up a surprising difference between New Zealand and the United States, where poor religious people have been driven apart from their natural economic classmates by wedge issues such as abortion, a phenomenon which is yet to be replicated in New Zealand, despite the best efforts of Brian Tamaki.
There was a correlation of 0.47 with voting Labour in 2014 and being a Hindu, which probably is a reflection of heavy Fijian Indian immigration over recent decades.
Although voting for Labour in 2014 had a significant correlation with having no qualifications, this was a barely significant 0.34. Some might be surprised that voting for Labour in 2014 had less of a correlation with not having a Master’s degree (-0.18) than voting Conservative did (-0.20). Considering that the average Labour voter is much younger, this suggests that the average Conservative is much more plebian.
The fact that the flag referendum was a National Party vehicle is demonstrated by the massive indifference of the working class to it. Voting for Labour in 2014 had a correlation of -0.84 with turnout rate in both the first and the second flag referendum, and a correlation of -0.80 with wanting to change the flag to the National Party design.
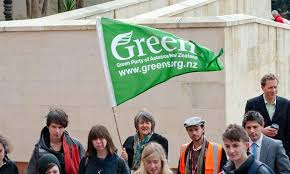
Perhaps the most interesting thing about the Labour Party vote is the size of the negative correlation with median age, which is -0.70. This is even lower than the Maori Party’s -0.66 and is far lower than the Green Party’s -0.17, which tells us that Labour is much more a party of the youth than the Greens (although this can be explained to a large extent by the fact that Polynesians are young and they seldom vote Green).
*
This article is an excerpt from Understanding New Zealand, by Dan McGlashan, published by VJM Publishing in the winter of 2017.