If a person is slapped awake for even the briefest of moments they might come to look around and ask why a parasitic class of politicians wields power of life and death over them despite a total lack of historical evidence that they are wise enough for the responsibility or even intelligent enough to comprehend that it exists.
The truth is that the ruling classes maintain their position in every time and place in the same simple way, and have done so ever since the first chimpanzee established a dominance hierarchy in the primeval jungle: by taking rights away from the people they rule, and then giving some of them back in exchange for submission.
This essay will describe the method of enslavement known as “democracy” – a method that has reached acute levels of sophistication in the modern West.
As described above, the essential pattern is bipartite: first, take rights away from the people; second, promise to give some of those rights back to the people in exchange for their submission.
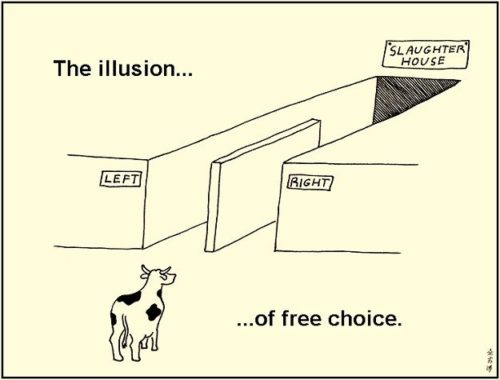
What’s crucial to understand is that the relationship described here is that of the rulers towards the ruled. Which flavour of political party the rulers use to swindle the rights of the ruled away from them is not relevant, as all political parties are tools of the ruling class.
Any political party is capable of taking rights away and giving rights back, because in a democratic system the masses have submitted to the rulers of that party. All that matters is that more rights are taken away than are given back.
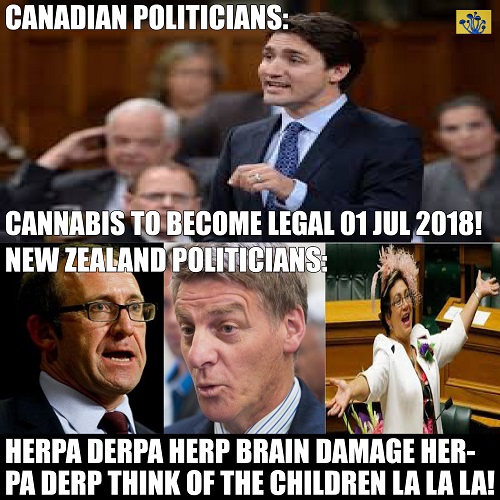
This can be seen when the National Party takes away people’s rights to use medicinal cannabis, but gives them back some of their right to keep the money they have earned.
The Labour and Green Parties, by contrast, will promise to give you your rights to use medicinal cannabis back, but they will take away some of your right to keep the money you have earned.
And both parties will team up to give you back your rights to have sex with people of the same gender as you, but will team up to take away your rights to recreational use of tobacco and alcohol. At least today – it was the other way around 80 years ago and probably will be again in 80 years’ time.
The trick is that as long as both wings of the political machine take away more rights than what they give back, the machine itself can stay in power forever, because there will always be an unjust deficit of rights somewhere and therefore always grounds for a politician to come in and start promising things.
Helen Clark, for example, knew that she could not make any progress on cannabis law reform between 1999 and 2008, because then the Labour Party would not be able to gain votes by promising to look at reforming the medicinal cannabis laws in 2017.
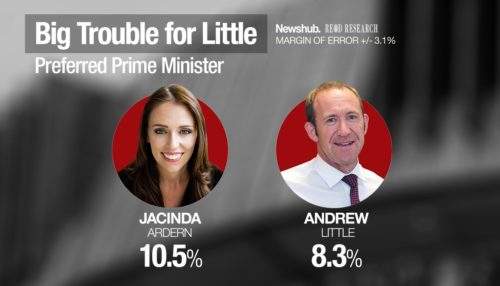
Likewise, Andrew Little in 2017 knows that, if he is to be elected to power, he must make the smallest possible amount of progress on the issue.
This is why he only makes vague mumblings about sorting out medicinal cannabis, but will not under any circumstances discuss the incredible success of the Colorado model, and how adopting it in NZ would save us $400,000,000 per year.
That is something that has to be left to Jacinda Ardern’s Seventh Labour Government in 2035 or so. If the Labour Party gave too many rights back to the people too quickly, they would lose the leverage that they are currently exploiting to stay in power.
Unfortunately, New Zealanders (like voters everywhere) reward this kind of carry-on by continuing to vote for whichever of its number the ruling class puts forward to rule them that electoral cycle.
After all, it doesn’t matter which party a politician claims to represent – as long as they are from the ruling class, nothing will change.
It can confidently be predicted that many New Zealanders will vote for the Green Party this year for the sake of relief from cannabis prohibition, and that little thought will be given to the people who will lose rights under a Labour-Greens Government – namely, taxpayers.
And it can be confidently predicted that the National Party will rely on the outrage of taxpayers to get back into power in 2026.
Likewise, it can be predicted that any rights that Kiwis can claw back from the ruling class regarding the use of cannabis will be outweighed by the loss of rights to access alcohol, tobacco, and other recreational alternatives.
As before; so after – the Hermetic axioms apply to time as well as space.