Understanding New Zealand: Voting Patterns of Pacific Islanders

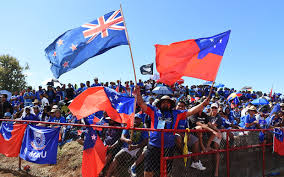
Many people, especially foreigners, tend to blithely assume that Maoris are more or less the same as Pacific Islanders, and could perhaps be placed in the same demographic category. Leaving aside the fact that both Maoris and Pacific Islanders would mostly object to this, there are statistical differences between the two groups that make them distinct.

The most notable thing about the Pacific Islander population is their love of the Labour Party. The correlation between being a Pacific Islander and voting Labour in 2014 was a very strong 0.78. For the most part, this simply reflects the degree to which Pacific Islanders in New Zealand tend to be working class.

The correlation between being a Pacific Islander and median personal income was -0.29, which is enough to suggest that the majority of them have an interest in voting for a left of centre party. There is also the correlation of 0.50 between being a Pacific Islander and working in the transport, postal and warehousing industries.

Predictably, then, there is a negative correlation between being a Pacific Islander and voting National, and this was -0.46. It’s worth noting that the Maori antipathy towards National was as strong as the Pacific Islander love of Labour, whereas the Maori love of Labour and Pacific Islander antipathy towards National were not as strong.

Perhaps reflecting the significant correlation between being a Pacific Islander and being born overseas (0.38), there is no significant correlation between being a Pacific Islander and voting New Zealand First in 2014 – this was -0.08.

Some believe that the Greens, in so far as they are a leftist party, get votes from socially disadvantaged people, but Pacific Islanders don’t see much in Green Party rhetoric to attract them. The correlation between being a Pacific Islander and voting Greens in 2014 was -0.27. Given that Pacific Islanders are not as socially disadvantaged as Maori, they might be the obvious next propaganda target for the Greens.

The votes for other parties reflected the dominance of Labour in the political minds of Pacific Islanders. They did not at all follow Maoris into voting for Internet MANA or the Maori Party – the correlation between being a Pacific Islander and voting Internet MANA in 2014 was 0.07, and for voting Maori Party in 2014 it was 0.01.

Neither were Pacific Islanders particularly interested in the far right of the spectrum. The correlation between being a Pacific Islander and voting ACT in 2014 was 0.06, which was not significant, and even this probably reflects the fact that ACT voters and Pacific Islanders both mostly live in Auckland more than it reflects any genuine ACT support among them.

Given the preponderance of religion and religious fundamentalism among Pacific Islanders in New Zealand, some might be surprised that the correlation between being a Pacific Islander and voting Conservative in 2014 was a significantly negative -0.29. However, the bulk of the Conservative Party vote was from the Anglican-Presbytarian-Baptist-Brethren axis and Pacific Islanders seldom belong to these movements.

Probably the largest difference in terms of magnitude for any one political party was with the Aotearoa Legalise Cannabis Party, voting for which in 2014 had a correlation of -0.10 with being a Pacific Islander, in contrast with 0.89 with being Maori. Possibly reflecting the Christian fundamentalist influence still, Pacific Islanders are vastly different to Maori when it comes to attitudes towards cannabis.

*

This article is an excerpt from Understanding New Zealand, by Dan McGlashan, published by VJM Publishing in the winter of 2017.

Understanding New Zealand: Demographics of Christians

The Abrahamist tradition of Christianity has come to New Zealand in several waves, each one contributing to the replacement of traditional Maori spiritual practice, most of which has now been forgotten. But just who are the numerous followers of this Middle Eastern cult in New Zealand?

The statistic that will surprise many people is that there is no significant correlation between being of European descent and being Christian in New Zealand – this was -0.07. There are several reasons for this.

The most obvious is that, when people in New Zealand think ‘Christian’, they usually, without realising it, think ‘Anglican’ or, especially on the South Island, ‘Presbytarian’. The correlation between being Anglican and being of European descent is a strong 0.60, and that between being Presbytarian and being of European descent is 0.40.

Christians are much more likely to be Pacific Islanders than they are either Maoris or Asians. The correlation between being a Christian and being a Pacific Islander is 0.46, compared to -0.37 for being Maori and 0.03 for being Asian. Predictably, given all of these statistics, there is a significant negative correlation between being born in New Zealand and being Christian (-0.24).

Old New Zealand and New New Zealand divide sharply in attitudes towards Catholicism. There is a correlation of -0.27 between being of European descent and being a Catholic, and a correlation of -0.28 with being Maori and being Catholic. This contrasts with the correlation of 0.40 between being a Pacific Islander and being Catholic and the correlation of 0.42 with being Asian and being Catholic.

The obvious explanation for this is the strong negative correlation between being Catholic and having been born in New Zealand, which was -0.41.

Attitudes towards Mormonism, on the other hand, divide European New Zealanders from the others. Kiwis of European descent are highly unlikely to be Mormons: the correlation between the two is -0.71. Asians are mostly indifferent, with a correlation of 0.07, but Mormons are very likely to be Maori (the correlation between the two is 0.54) and even more likely to be Pacific Islanders (the correlation there is 0.68).

The reason for this is Mormons are generally quite hard done by. The correlation between being Mormon and median personal income is -0.46. Likewise, being a Mormon is negatively correlated with having any of the four university degrees. This reflects a deliberate strategy on the part of the Mormon church to target vulnerable people with their propaganda, knowing that the more desperate someone is the more likely they are to fall prey to a religion.

It could be predicted from the above that Anglicans and Presbytarians are signficantly more likely to be old. And they are – the correlation between median age and being Anglican is 0.56, and between median age and being Presbytarian it is 0.43.

Being Christian had a significant negative correlation with having a university degree, and looking closer at this shows a few distinctions. Being Catholic was positively correlated with having a Bachelor’s degree (0.37), with having an Honours degree (0.31) and with having a Master’s degree (0.37), which went against the general trend.

It was the mystery category of ‘Christian not further defined’ that caused the overall correlations between being Christian and having a university degree to be negative. Being ‘Christian not further defined’ had a correlation of -0.24 with having a Bachelor’s degree, -0.37 with having an Honours degree, -0.26 with having a Master’s degree and -0.39 with having a doctorate.

For both Maoris and Pacific Islanders, the correlation between being in this category was greater than it was for people of European descent or Asians. So this category may contain the various Christians that have not been raised in a particular subreligion (such as Anglicanism), i.e. adult converts, who as a rule have it worse than adults who follow the religion they were raised into.

Working in no industry had a positive correlation with being Christian, but many had negative correlations. The strongest was between being Christian and working in the arts and recreation services. This was a very strong -0.63. Perhaps the reason for this is that people who work in arts are iconoclastic by their very nature, as most creative people are, and therefore reject religious tradition.

There was also a strong negative correlation between being Christian and working in administrative and support services (-0.52), accommodation (-0.49), education and training (-0.48) and information media and telecommunications (-0.40). The most likely explanation for at least some of these is that Christians tend to be much older than the average worker in these industries.

There is also a significant negative correlation between being a Christian and being a professional (-0.42), reflecting the generally poor academic achievements of Christians.

Perhaps reflecting a general middle-of-the-road conservatism, being Christian had a negative correlation with being in all of the income bands below $15K and all of the bands above $50K. This was not the case for Catholics, who had a correlation of 0.30 with being in the $100-150K income band and a correlation of 0.24 with being in the $150K+ band.

Reflecting a combination of age, seniority and political dominance, there was a significant correlation between being Anglican and being a manager – this was 0.44.

The point about political dominance and disenfranchisement is underlined by the significant positive correlations between turnout rate in 2014 and being Anglican (0.41) and between turnout rate in 2014 and being Presbytarian (0.32). Contrast this with the very strong -0.68 between turnout rate in 2014 and being Mormon.

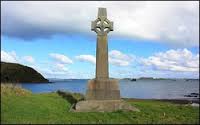
Presbytarians are very strong on the South Island, refecting the strong Scottish influence there. The correlation between being a Presbytarian and being a South Islander is 0.56.

*

This article is an excerpt from Understanding New Zealand, by Dan McGlashan, published by VJM Publishing in the winter of 2017.
South Africa in New Zealand 2017 Limited Overs Series Preview

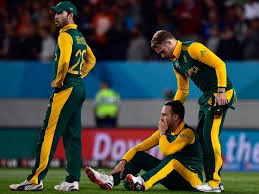
The theme of revenge for South Africa’s 2015 Cricket World Cup semifinal loss to the Black Caps has been well established. The Proteas came to Auckland with every reason to think they had what it took to seize a place in the World Cup final, but were denied at the last moment.

The Limited Overs leg of this year’s tour begins tomorrow and involves six matches. For South Africa there might be something of the 2015 World Cup about it, as the final match is, once again, at Eden Park.

The leg begins with a T20, also at Eden Park. Much of the interest in the T20 revolves about the late call-up of prodigious Auckland talent Glenn Phillips, who is replacing the injured Martin Guptill.

The 20-year old Phillips is already being talked about as a talent on the order of Kane Williamson and Tom Latham. In last year’s Super Smash he scored 369 runs at an average of 46 and a strike rate of 143, including one century scored at a strike rate of 200.

That is the sort of hitting the Black Caps will need at the top if they are to find an adequate replacement for Guptill. In limited overs matches the Black Caps know that if Guptill goes big, they win, because his striking ability is unmatched.

New Zealand sit comfortably on top of the current world T20I rankings, with South Africa at fourth. It’s almost exactly the other way around in the ODIs, with South Africa ranked at the top and the Black Caps third.

Despite that, the Black Caps are currently paying $2.34 on BetFair to win the T20, so there appears to be some value there.

The South African batting features four of the top ranked seven batsmen in the world at the moment, in AB de Villiers, Faf du Plessis, Hashim Amla and Quentin de Kock. With any four of those players capable of a matchwinning innings, that makes the Proteas top order arguably the strongest ODI top order that has ever come to these shores.

The Black Caps, for their part, have a diverse and highly skilled array of artillery to break through this. But barring Trent Boult, who is currently ranked the No. 2 ODI bowler, none of them can rightly be said to be at the same skill level as the South African batting lineup.

Although there is much to choose from out of Matt Henry, Tim Southee, Lockie Ferguson, Mitchell McClenaghan and Adam Milne (the latter two returning from injury), none of those names pose the known and established threat that Boult does.

Probably the Black Caps will pick Trent Boult, one of the two speedsters (likely to be Ferguson who is in the squad ahead of Milne) and the other spot will be decided by who is best for the conditions out of Henry and Southee.

Ish Sodhi will also be back in case the Black Caps decide to try and strangle the South Africans with the spin of Sodhi, Mitchell Santner and perhaps even Williamson. If the seamers end up getting dominated by the superb Proteas batsmen, expect a wholesale shift to Plan B: strangle by spin.

The South African bowling unit would generally back itself to defend the large totals their batsmen would expect to put up. They have the No. 1 ranked ODI bowler in Imran Tahir, and the ever-more impressive Kagiso Rabada, who is ranked equal with Matt Henry at 7.

Rabada ought to find New Zealand pitches to his liking, with his Courtney Walsh-style action a test of any batsman’s technique. Chris Morris might be hard to get away but Wayne Parnell, JP Duminy and Andile Phehlukwayo will not be names the Black Caps batsmen are afraid of.

Dean Brownlie scored an excellent 63 in the Black Caps’ Hadlee-Chappell winning effort in their last ODI against Australia, and he has been selected to open in place of Guptill for the first two ODIs (Guptill is expected to be fit for the third).

The rest of the Black Caps top order looks very strong, with Latham, Williamson and Ross Taylor making up the remainder. With Luke Ronchi back in the ODI squad there is plenty of middle order hitting power as well.

Expect a high-scoring series in stark contrast to the recent Hadlee-Chappell, as both South Africa and the Black Caps have considerably stronger batting lineups than they do bowling attacks. It is, however, likely to be close, with a 3-2 win to the Proteas probably the slight favourite over a 3-2 to the Black Caps.

Understanding New Zealand: Maori Party Voters

The Maori Party is a bit of a misnomer. Sure, they represent Maori, but not all Maori – only some. Let’s get the obvious one out of the way: the correlation between voting Maori Party in 2014 and being of Maori descent is an extremely strong 0.91. The correlation between voting Maori Party in 2014 and being a Pacific Islander was a not significant 0.01, and the other two correlations, with being European and being Asian, were both significantly negative at -0.35 and -0.30 respectively.

What may seem incredible if you look at Parliament, but not surprising if you knew about Kiwis, is the size of the negative correlation between voting National in 2014 and voting Maori Party in 2014: this is -0.75. That is enough to suggest that the average Maori Party voter has very, very little in common with the average National voter, even though the Maori Party supports National in Parliament.

With no other party was there as large a negative correlation with voting Maori Party in 2014. Voting Maori Party had a correlation of -0.64 with voting Conservative, and -0.29 with voting ACT. Imagining some kind of blend of National, Conservative and ACT voters can give us an idea of what an anti-Maori would be like if one existed.

Maori Party voters were indifferent to the Greens. Voting Maori Party in 2014 had a correlation of 0.02 with voting Green in 2014. They do, however, seem to like the other strongly pro-Maori parties. Voting Maori Party in 2014 had a correlation of 0.41 with voting Labour and a correlation of 0.46 with voting New Zealand First.

The strongest correlations with voting for the Maori Party were with Internet MANA (0.84) and the Aotearoa Legalise Cannabis Party (0.85). Those two correlations may give a clue as to the sense of betrayal that many hard done by Maori will be feeling at the actions of the Maori Party MPs elected to Parliament, who raised tobacco taxes and did nothing about cannabis prohibition.

There is a fairly big difference between some correlations that the reader may have expected to be close to equal. One set of them relates to the strength of the correlation between being educated and being Maori and between being educated and voting Maori Party.

The correlation between being Maori and having a Bachelor’s degree is -0.45, but the correlation between voting Maori Party in 2014 and having a Bachelor’s degree is only -0.28. There was a similar pattern for all of the postgraduate degrees.

For being Maori and having an Honour’s degree the correlation was -0.46, but for voting Maori Party in 2014 and having an Honour’s degree it was only -0.29. For being Maori and having a Master’s degree the correlation was -0.45, but for voting Maori Party in 2014 and having a Master’s degree it was -0.28. And for being Maori and having a doctorate was -0.41, but for voting Maori Party in 2014 and having a doctorate it was 0.27.

A similar pattern repeats itself if we look at correlations with income bands. The $60-70K income band is perfectly even, in that the correlations between being in this band and being either Maori or voting Maori Party are both exactly 0.00.

For all of the income bands below this, the correlation with being Maori was more strongly positive than it was for voting Maori Party in 2014, but the opposite was true of the three income bands above this one.

A similar pattern repeats if one examines the difference when it comes to claiming benefits. The correlation between being on the unemployment benefit and voting Maori Party in 2014 is 0.79, but the correlation between being on the unemployment benefit and being Maori is 0.91. Similarly, the correlation between being on the invalid’s benefit and voting Maori Party in 2014 is 0.59, but the correlation between being on the invalid’s benefit and being Maori is 0.77.

One difference, and one major clue as to how Maori Party voters differ from general Maori, is that the correlation between being on a student allowance and voting Maori Party in 2014 (0.26) is stronger than the correlation between being on a student allowance and being Maori (0.20). This tells us that the average Maori Party voter is generally more driven and aspirational than the average Maori.

A general picture emerges of Maori Party voters being significantly better off than the average Maori person. This cannot be explained by turnout alone. The correlation between turnout rate in 2014 and being Maori is -0.75, and with between turnout rate in 2014 and voting Maori Party in 2014 it is -0.74. So there is no significant difference there.

This is supported by general measures of health and well-being. The correlation between having never smoked tobacco and voting Maori Party in 2014 (-0.55) is weaker than the correlation between having never smoked tobacco and being Maori (-0.73). In a similar vein, the correlation between being a solo parent and voting Maori Party in 2014 (0.66) was not as strong as the correlation between being a solo parent and being Maori (0.79).

There are several potential implications of this. One of the most notable is that, if Maori Party voters are actually significantly wealthier than the average Maori, a partnership with National as not as odd as it might otherwise appear.

*

This article is an excerpt from Understanding New Zealand, by Dan McGlashan, published by VJM Publishing in the winter of 2017.