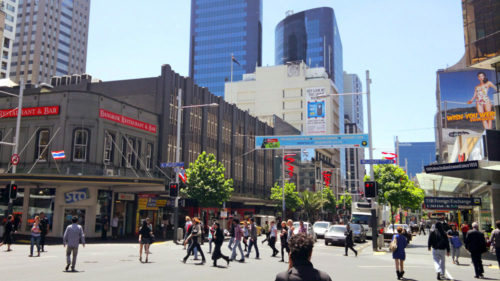
Asians represent the fourth major wave of immigration to New Zealand, and, partially as a consequence, their voting patterns are the least well understood. What makes it especially difficult is that “Asian” covers a very large number of people, many of whom are very distinct from some of the others.
The most striking thing about Asian New Zealanders is their love of the ACT Party. The correlation between being Asian and voting ACT in 2014 was an extremely strong 0.85, which is enough to suggest that most ACT voters are Asians (note that it does not mean most Asians are ACT voters, because the population of Asians is many times higher than the number of ACT voters).
As is described elsewhere, the highly educated class tends to split into a right wing that votes ACT and a left wing that votes Green. If the correlation between voting ACT in 2014 and being Asian is so strong, one could predict that there were fewer educated Asians left to vote Green, and indeed the correlation between voting Green in 2014 and being Asian was 0.00.
Also because of the extremely strong ACT support, one could predict that there was little conservative sentiment left over for supporting the National Party. This is indeed the case – the correlation between being Asian and voting National in 2014 was 0.09. There was even less for the real Conservative Party, voting for which in 2014 had a correlation of -0.07 with being Asian.
The correlation between being Asian and voting Labour, by contrast, was 0.17. Some might be surprised by this, given that there are a large number of Asians attracted to the ACT Party. The explanation is that most of the ACT-voting Asians are from Far East Asia and the many from India, Thailand, Malaysia etc. are more likely to have social democratic sentiments.
Given that Maoris were the first wave of immigrants and Asians the most recent, it’s not really surprising that being Asian had a significant negative correlation with voting for any of the four Maori-heavy parties. Being Asian had a correlation of -0.23 with voting Internet MANA, one of -0.30 with voting Maori Party, one of -0.50 with voting Aotearoa Legalise Cannabis Party and one of -0.60 with voting New Zealand First.
*
This article is an excerpt from Understanding New Zealand, by Dan McGlashan, published by VJM Publishing in the winter of 2017.
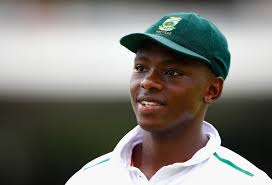
Kagiso Rabada, at only 21 years of age, is considered one of the most likely to play an influential role in this series
The limited overs leg of the 2017 South Africa tour of New Zealand was a close-fought contest that ended in South Africa’s favour. As the limited overs game is New Zealand’s strong suit, that means that the South Africans will take the ascendancy into the three-match Test series beginning tomorrow in Dunedin.
South Africa are ranked No. 3 in the world and the Black Caps No. 5. This might not be a large gap but the market is much more confident of a South Africa win. The Proteas are paying only $2.24 on BetFair to win the First Test, compared to the Black Caps paying $3.70 and the Draw $3.60.
Since then, the Black Caps have demolished both Pakistan and Bangladesh at home. Although South Africa will be tougher than either of those two Asian sides in New Zealand conditions, the Black Caps’ home advantage should make this series more interesting than the previous encounter in South Africa last August.
If one makes the assumption that Tom Latham’s poor recent ODI form will not carry over into the Test arena, then the Black Caps top order looks as solid as it ever has been.
They will have the highest ranked Test batsman on display for either side, in Kane Williamson at 4th. His returns in the past year have been good but mediocre by his high standards and he would like to play a defining innings against the South Africans.
Ross Taylor at 15th and Tom Latham at 26th, with Jeet Raval looking solid in his limited opportunities so far, make it a respectable, if far from intimidating, Black Caps top order.
They will not be favoured to dominate the South African bowling attack, though, even in the absence of Dale Steyn. The 21-year old Kagiso Rabada had barely had time to find his feet but has already risen to 5th in the Test bowling rankings, with two five-wicket hauls in only 14 Tests.
He will likely open the bowling with Vernon Philander, who averages 21.40 with the ball over 40 Tests. In terms of bowling average, at least, it will be easily the most formidable opening bowling pair the Black Caps have faced since their last series against South Africa.
They also have Morne Morkel, whose height and bounce pose a threat that New Zealand batsmen rarely face, and an almost total unknown in left-arm orthodox Keshav Maharaj.
The Black Caps have no real bowling spearheads but are capable of sustained pressure. Neil Wagner, Trent Boult and Tim Southee occupy positions 11 to 13 on the Test bowling rankings table.
These three bowlers have proven themselves capable of hunting as a pack, and the variety of Wagner’s left-arm bouncer barrage, Boult’s left-arm swing and Southee’s right-arm seam should make it difficult for the South African batsmen to settle. It will also be interesting to see if Mitchell Santner can usefully transfer his tight ODI bowling into the Test arena.
The South African Test batting unit might not be as terrifying as it is in ODIs but it still poses a threat. They do not have AB de Villiers for this series but both of Hashim Amla and Quentin de Kock are ranked in the top 10 and either could play a matchwinning knock.
The Black Caps bowlers will back their bowling plans against the other batsmen like Faf du Plessis, Stephen Cook, Dean Elgar, JP Duminy and Temba Bavuma. None of the batsmen in South Africa’s second tier pose a particular threat but all are very good players. Even if the Black Caps pick up a string of wickets somewhere they will always have to work hard to get the rest.
A heavyweight South Africa side without their best two players and playing in foreign conditions over three Tests against a middle-of-the-pack Black Caps side hungry to make the top tier promises to be highly competitive cricket. This column is guessing the most likely outcome to be a two-one win to South Africa or a one-all draw.
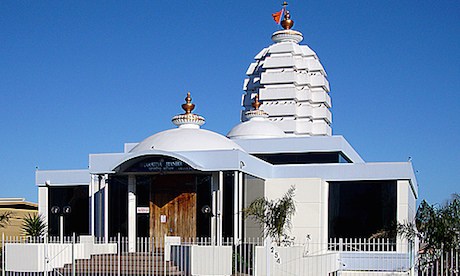
The voting patterns of the non-Christian religious in New Zealand reflected that many of them were immigrants
The Parliamentary Profiles contain information on all manner of religions. Even though India and China are much closer to the New Zealand than the Middle East is, the Middle Eastern religions have a much higher profile here than the Oriental ones.
The vast majority of Kiwi Buddhists are Asians, despite the number of Kiwis of European descent that the reader may have met claiming to be Buddhists. Being a Buddhist in New Zealand has an extremely strong correlation, of 0.87, with being born in North East Asia.
This third factor of being Asian explains why Buddhists love the ACT Party. Being Buddhist has a correlation of 0.85 with voting for ACT in 2014, although there is nothing obvious in Buddhist doctrine that would lead a person towards supporting the ACT Party.
Probably also because of the third factor of being Asian and an immigrant, there was a correlation of -0.66 between being Buddhist and voting for New Zealand First.
Of the other three major parties, Buddhists are indifferent. None of the correlations between being Buddhist and voting National in 2014 (0.15), voting Labour in 2014 (0.08) and voting Green in 2014 (0.12) were significant. This might suggest that Buddhist immigrants to New Zealand have generally peacefully integrated.
There were significant negative correlations between being Buddhist and voting for the other three Maori-heavy parties. With voting Internet MANA in 2014 it was -0.26, with voting Maori Party in 2014 it was -0.33 and with voting Aotearoa Legalise Cannabis Party it was -0.52.
Perhaps most fittingly, Buddhists were perfectly indifferent to the idea of voting in general – the correlation between being Buddhist and turnout rate in 2014 was 0.00.
Hindus followed the general pattern of demographic groups that have a high proportion of immigrants voting ACT out of a lack of solidarity with other Kiwis – the correlation between being Hindu and voting ACT was 0.50.
This absence of solidarity is not something that we can say is a general rule for all Hindus – the correlation between being Hindu and voting Labour in 2014 was 0.47. This might reflect that many Hindus are from Fiji and therefore will be attracted to Labour in the same way that other Pacific Islanders are.
Probably reflecting that many of them are immigrants, there were significant negative correlations between being Hindu and voting for three of the four Maori-heavy parties in 2014.
With voting for New Zealand First it was -0.40, with voting Aotearoa Legalise Cannabis Party it was -0.40, and with voting for the Maori Party it was -0.24. Only for voting Internet MANA in 2014 was the correlation with being Hindu not significant – and it was still -0.19.
If the Hindu left likes Labour and the Hindu right likes ACT, we can predict two things: a negative correlation with being Hindu and voting both Green and National in 2014. Indeed, the correlation for the former is -0.09 and for the latter it is -0.13.
Perhaps reflecting a minor degree of disenfranchisement, there is a negative but not significant correlation between turnout rate in 2014 and being Hindu: this was -0.17.
Muslims were very similar to Hindus on most counts, probably reflecting the third factor of a shared South Asian origin. The correlation between being Muslim and voting for a particular political party was identical to the Hindu one in the case of both voting ACT (0.50) and voting Aotearoa Legalise Cannabis Party (-0.40). In the case of the others it was very similar.
It was more positive in the case of Labour (0.51), Green (-0.05), Maori Party (-0.23) and Internet MANA (-0.16). It was more negative in the case of National (-0.17), Conservative (-0.16) and New Zealand First (-0.46).
Taken together, this group of correlations suggest that Muslims are generally in the same voting bloc as Hindus, but they have slightly more leftist sympathies. The correlation between turnout rate in 2014 and being Muslim (-0.21) is also slightly more strongly negative than the correlation with being Hindu. This may reflect that Pakistan is a considerably less wealthy nation than India.
The voting patterns of Jews reflected two things: that they are generally in high socioeconomic categories and that they have very, very little nationalist sentiment towards New Zealand. These factors are reflected in the correlations between being Jewish and voting Green, ACT or New Zealand First.
Like other highly-educated demographics, Jews appear to eschew the everyday Labour-National paradigm. The correlation between voting Green in 2014 and being Jewish was 0.43, and the correlation between voting ACT in 2014 and being Jewish was 0.42. These two correlations reflect that there is also a moderate positive correlation between being Jewish and being born overseas.
Being Jewish was negatively correlated with voting for any of the parties that traditionally appeal to less educated people. The correlation with being Jewish and voting Labour in 2014 was -0.25, and with voting Conservative in 2014 it was -0.15.
If globalist sentiments are so widespread among Jews, then it comes as little surprise that being Jewish is negatively correlated with the four Maori-heavy parties, and especially so for New Zealand First, voting for which in 2014 had a correlation of -0.57 with being Jewish. For voting Internet MANA it was -0.15, for voting Maori Party it was -0.18 and for voting Aotearoa Legalise Cannabis Party it was -0.31.
Reflecting a low degree of disenfranchisement, mostly on account of that many Jews are highly educated and work as professionals, there was a correlation of 0.30 between being Jewish and turnout rate in 2014.
*
This article is an excerpt from Understanding New Zealand, by Dan McGlashan, published by VJM Publishing in the winter of 2017.
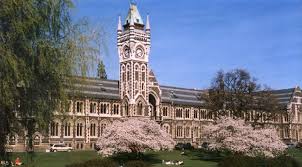
To some extent, a person will become educated to the degree that they are a part of society. Engagement with society in one regard generally predicts engagement with society in another.
This can help explain why there is a significant negative correlation between turnout rate in 2014 and having no qualifications (-0.28) and a significant positive correlation between turnout rate in 2014 and having an Honours degree (0.25) and having a doctorate (0.27).
Some might be surprised that this correlation is not even stronger, and in truth it probably should be. This is discussed at length in the article ‘Understanding New Zealand: Demographics of Education’.
One might make the assumption that, because having a higher education is correlated with a high turnout rate, and because voting National is correlated with having a high turnout rate, that having a higher education must also be correlated with voting National.
This is not an accurate assumption. There is a positive correlation between having a Bachelor’s degree and voting National in 2014, although this is a barely significant 0.25. Holding none of the three higher degrees had a positive correlation with voting National in 2014.
The weak positive correlation between being highly educated and voting National in 2014 was mirrored in the weak negative correlation between being highly educated and voting Labour in 2014. This was only significant for having an Honour’s degree and voting Labour in 2014, which was -0.28. For the other degrees it was negative but not statistically significant.
The university educated especially love to vote for the Green Party. The correlation between voting Green in 2014 and having a degree was 0.57 for a Bachelor’s, 0.75 for a Honours, 0.64 for a Master’s and 0.67 for a doctorate. These were easily the strongest positive correlations for any party.
The only party even vaguely comparable on this front was ACT. Voting ACT in 2014 had a correlation of 0.65 with having a Bachelor’s degree, which was even higher than the correlation between voting Green and having a Bachelor’s. The correlations with having one of the three higher degrees were, however, lower with voting ACT in 2014 than voting Green in 2014: 0.40 for an Honours, 0.57 for a Master’s and 0.30 for a doctorate.
These two parties were balanced by New Zealand First, voting for which had easily the strongest negative correlations with having a degree. Voting for New Zealand First in 2014 had a correlation of -0.76 with having a Bachelor’s degree, -0.72 with having an Honours degree, -0.76 with having a Master’s degree and 0.63 with having a doctorate.
The reason for this is that New Zealand First draws much of its support from pensioners and Maoris, the former having few higher degrees because of limited educational opportunity when they were young and the latter having few degrees on account of various socioeconomic disadvantages and cultural disincentives.
Voting Conservative in 2014 was not significantly correlated with having any of the degrees. In fact, all four correlations were bordering on significantly negative. This suggests that the Conservative Party targets the same kind of poorly educated, paranoid and aggressive religious fanatic that the American Republican Party does.
Although voting for the Maori Party in 2014 was significantly negatively correlated with having any degree, voting for Internet MANA was only significantly negatively correlated with having an Honours degree, whereas the correlations for the other three were, although negative, not significant.
This probably reflects the fact that Internet MANA appealed to a slightly broader cross-section of New Zealanders than the Maori Party, and hence to several demographics that are better educated than the Maori one.
This was also true of the Aotearoa Legalise Cannabis Party, voting for which in 2014 also had significant negative correlations with holding any of the four degrees. With having a Bachelor’s it was -0.46, with having an Honours degree it was -0.42, with having a Master’s degree it was -0.46, and with having a doctorate it was -0.38.
Predictably, these figures were all, for the most part, mirrored in the other direction. Namely, all the voting patterns of people with very low qualifications or none at all were the opposites of the patterns of people with high qualifications.
*
This article is an excerpt from Understanding New Zealand, by Dan McGlashan, published by VJM Publishing in the winter of 2017.