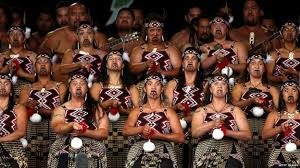
Understanding New Zealand: Demographics of Maori New Zealanders

Most Kiwis are generally aware that the average Maori is doing it harder than the average Kiwi by a range of measures, but may not be sure precisely why. In any case, there is much more to the Maori experience than just that.

The correlation between median personal income and being Maori is a moderate -0.48. This is enough to tell us that the average Maori is considerably poorer than the average Kiwi. However, this correlation is not quite as meaningful as it might appear on the surface.

The correlation between median age and being Maori is even stronger, at -0.63, and because there is a mildly significant positive correlation of 0.27 between median age and median personal income it is fair to conclude that Maori are poorer than average, to a small extent, because they are younger than average.

There is a fair amount of cynicism among Maoris regarding Paheka religions. This is reflected in the fact that being Maori has a significant negative correlation with being a Christian, which is -0.37. This will surprise those any who expect that Maoris are like Pacific Islanders in all regards. The correlation between being a Pacific Islander and being a Christian is a moderately strong 0.46, so they are very different to the Maori in that sense.

There is no significant correlation between being Maori and being Anglican – this is 0.02. Being Maori has significant negative correlations with practicising a variety of religious traditions: with being a Catholic it is -0.28, with being Presbytarian it is -0.40 and with being Buddhist it is -0.45.

Even more surprising to some is the strong positive correlation between being Maori and being a Mormon (0.54), as well as the correlation between being Maori and following Spiritualism and New Age religions, which was a mildly significant 0.24. In this latter correlation the Maori share something exclusively with the Paheka, who also have an interest in these traditions, unlike Pacific Islanders and Asians.

The explanation for the strong negative correlation between being Maori and net personal income becomes obvious if one looks at the correlations between being Maori and maximum educational achievement.

Being Maori had a moderate positive correlation with being in all three groups with the poorest education. Being Maori had a correlation of 0.57 with a Level 2 education, of 0.55 with a Level 1 education, and of 0.67 with no qualifications at all.

Even worse for the purposes of making a good income, being Maori had a significant negative correlation with having any of the university degrees. With having a Bachelor’s degree the correlation was -0.45, with having an Honour’s degree it was -0.46, with having a Master’s degree it was -0.45 and with having a doctorate it was -0.41.

It is known that Maori men in particular have the lowest life expectancy of any of the major population groups in New Zealand. Few would dare guess that things are so bad for Maori men that there is a significant correlation between being Maori and being female – this is 0.31.

Related to this unusual death rate, there is one pattern that stands out when it comes to the demographics of Maori. Although Maori are only doing moderately worse than the Kiwi average when it comes to most measures of social health and wellbeing, they still comprise the bulk of the Kiwis at the very bottom of the ladder, who have it hardest of all.

There is a correlation of 0.91 between being Maori and being on the unemployment benefit and a correlation of 0.77 between being Maori and being on the invalid’s benefit. There is also a correlation of 0.92 between being Maori and being a regular smoker and a correlation of 0.79 between being Maori and being a solo parent.

These are very strong correlations and suggest that much of the worst social devastation has happened to Maoris.

There is a significant positive correlation between being Maori and all of the income bands from Loss or No Income up to $50K. There is a significant negative one between being Maori and the three income bands above $70K. One can guess from this that working class industries and occupations are the general trend.

The significant positive correlations between being Maori and working in a particular industry are 0.47 for working in transport, postal and warehousing, 0.44 for working in manufacturing, 0.43 for working in education and training, 0.42 for workign in electricity, gas, water and waste services, 0.38 with working in administration and support services, 0.32 for working in healthcare and social assistance and 0.31 for working in construction.

There are only two industries with a significant negative correlation with being Maori: professional, scientific and technical services at -0.33 and financial and insurance services at -0.26. The former of these is not surprising considering the unusually low representation of Maori on the higher rungs of the education ladder.

True to the long-held stereotype of “Maori being good on guitars and bulldozers”, there is a very strong correlation between being Maori and working as a machinery operator or driver – this is 0.66. There is also a strong correlation of 0.62 between being Maori and being a labourer. The strongest correlation between being Maori and any occupation, however, is with community and personal services, which is 0.72.

Predictably, there is a strong positive correlation between being Maori and having been born in New Zealand – this is 0.70. This may not even be as strong as some might predict, but it ought to be kept in mind that the vast majority of New Zealand Europeans are native born and that there are large Maori populations in Sydney, Melbourne and Brisbane.

*

This article is an excerpt from Understanding New Zealand, by Dan McGlashan, published by VJM Publishing in the winter of 2017.

What Waitangi Day Could Mean For New Zealanders

Today is Waitangi Day, the national holiday of New Zealand. Our national holiday is today because it commemorates the signing of the Treaty of Waitangi, the document of partnership between the native Maori tribes and the British pioneers that led to the founding of modern New Zealand.

Everyone knows that. Here’s something you probably didn’t know. In the original articles of Australian Federation, which are held for public viewing in the Australian National Museum, it stated clearly that only white people and Maoris were allowed to vote in Australian Federal elections.

Why Maoris?

The framers of the early Australian Constitution were no fools, but they were not right about everything. Back in the late 19th century when the desire for federalism swept the Australian continent in response to an ever-increasing majority of the people being native born, it was anticipated that New Zealand would join the nascent Southern nation as another state.

After all, New Zealand was born of exactly the same sociohistorical phenomenon as Australia – the British Empire – and the white majority of New Zealand was not much culturally different to the white majority of Australia.

There was one catch. The early framers of the Australian constitution knew that the New Zealand Maori had been treated in a significantly different manner to the Aborigines of Australia, and that race attitudes were very different across the Tasman Sea.

Maori New Zealanders have had their own Parliamentary representation since 1868, about a century before Australian Aborigines were considered proper human beings by their settler culture.

In other words, it has been known from the beginning that our attitude to the native people made us fundamentally different in mentality to our brothers across the ditch.

The reason why Maoris were given the right to vote in Australian Federal Elections from the very beginning – unlike any other non-white race on Earth – is because it was understood that white New Zealanders would simply not accept federation into Australia otherwise.

Let’s be very clear about something at this point: this relationship is not one-way traffic. This intent of this essay is not to glorify the mostly middle-class people who colonised New Zealand and contrast them with the mostly working-class people who colonised Australia.

The Treaty of Waitangi is a partnership agreement that the Maoris have lived up to. By the standards of most international treaties in history that makes it very rare – and very precious.

One time at a factory I worked at in Brisbane, a pack of local bogans had cornered me and one of our co-workers, a Maori fellow named John. They engaged us in a conversation about who would win in a fight between the two of us and the six or seven or them.

John grinned and said: “We Kiwis are lovers, not fighters.”

It was a cunning way to defuse the situation, and it ended in good cheer. But it occurred to me shortly afterwards, based on what else I had observed in my half a year in Australia about the relations between white Australians and Aborigines, that it was highly unlikely an Aborigine would find cause to say the same about a white Australian.

Can an Australian Aborigine genuinely look at a white Australian and see one of his own, in the way a Maori New Zealander can look at a Paheka? Of course not. In fact, nothing like it.

This column’s contention for Waitangi Day is this. Forget the attention whores, the tub thumpers, the race baiters, the shit stirrers, and all the other dickheads who have turned this day into a low-rent freakshow. Let them have their day in front of the peanut gallery.

They have tried to divide and conquer us, as the ruling classes always have done to the people they have ruled, but in this they have failed.

However, let’s not dwell on that.

Instead, let us focus on the fact that the way we Kiwis have conducted race relations since the foundation of New Zealand has left us with far fewer daily unpleasantries than people of most other European colonies.

On my first day in Sydney, I walked out of the train station and up the main street towards the central city. On a dirty, water-logged mattress shoved up against a brick wall were a group of Aborigines, drinking meths out of plastic bottles.

On one of the first days I spent in Los Angeles I cycled to Malibu from Manhattan Beach. At Malibu, one can look up to the hills and see houses built like castles on huge sections, each property surely worth eight figures. From the same spot, one can look down to the beach and see several dozen people who sleep in cardboard boxes, and all of them are black.

And these are stories about the Functioning World; the non-Functioning World has horror stories about the friction of cultural borders rubbing up against each other that one can hardly believe.

On Waitangi Day, let’s spare a thought for the naked fact that, in most of the rest of the world, race relations are so bad that your skin colour is akin to a uniform and every street akin to a battlefield.

We managed to dodge the vast bulk of that – partly through design, partly through goodwill, partly through luck. Let’s take this day to appreciate that.

Understanding New Zealand: Turnout Rate of Party Supporters

What sort of political party supporter actually turns out to vote? It’s not as straightforward and simple as just old, rich, male and white. However, turnout rate can serve as a useful indicator of general disenfranchisement.

Interestingly, the correlation matrix gives us a clue about a line of information that is completely closed off to anyone running a simpler analysis: we can know which party has the supporters that are most likely to vote by looking at the correlation between party vote in each electorate and the turnout rate in that electorate.

It seems fair to assume that, all other things being equal, the turnout rate of any party’s supporters is roughly equal to the degree that those supporters feel their needs and desires will be taken seriously by the eventual representatives. After all, if your vote will not count for anything because your MP will ignore you anyway, why bother to cast it?

Perhaps more than any other set of correlations, this one tells us who is running the country. If you have money and wealth, you can vote knowing that whoever wins the election will listen to you out of natural shared solidarity. If you are disadvantaged – poor, physically or mentally ill, female in some cases, the wrong religion or race in many others, you can’t.

Unsurprisingly, there is a strong correlation between turnout rate in 2014 and voting for National – this was 0.76. The Labour one, at -0.67, was almost as strong in the other direction. This difference represented by this correlation arguably reflects the most fundamental political division in society – between the haves and the have-nots.

This correlation is large enough that we can predict the vast majority of people who do not turn out to vote are Labour supporters.

Reflecting that the average Green voter is significantly wealthier than the average Kiwi, there is a significant correlation between turnout rate and voting Green – this is 0.26. Probably this would be higher if it reflected the level of class privilege of the average Green voter, but because the average Green supporter is also so young the turnout rate is somewhat suppressed.

The turnout rate was, as it was for Labour, significantly negatively correlated with New Zealand First support. The correlation here was a moderately strong -0.40, which is possibly even a little less negative than one might have expected based on the income of the average New Zealand First voter. Even though the bulk of New Zealand First supporters are working-class Maoris and thus have a low turnout rate, the party has a core of elderly white voters who can be counted on to vote.

The turnout rate was moderately correlated with voting for the Conservative Party in 2014 – this was 0.55, easily the second highest of all the correlations between turnout rate and voting for a party. This is even though voting Conservative in 2014 did not have a significant correlation with median personal income.

The main reason for this is the strong correlation between voting Conservative in 2014 and median age, which was 0.75. Because old people vote at significantly greater rates than the young, and because old people are religious fundamentalists at significantly greater rates than the young, old people will vote for a party (like the Conservatives) that appeals to religious fundamentalism.

All of the parties that had a high proportion of Maori voters had a significantly negative correlation with turnout rate. The correlation between turnout rate and voting Maori Party in 2014 was -0.74, with voting Internet MANA it was -0.69, with voting Aotearoa Legalise Cannabis Party it was -0.68 and with voting New Zealand First it was -0.40.

None of these are surprising considering the strong negative correlation between turnout rate and being Maori (-0.74). It may be that the natural support levels of both the Maori Party and Internet MANA are closer to what the Conservative Party is pulling in, but because of massive disenfranchisement among Maori are unable to translate that support into seats in Parliament.

*

This article is an excerpt from Understanding New Zealand, by Dan McGlashan, published by VJM Publishing in the winter of 2017.