Why do people love cats so crazily much? Is it the cuteness, the companionship, the intelligence, the charm? It could be any of those things, but this article will investigate a cold, scientific proposal: that we love cats because we have evolved to.
It is believed that the cat was domesticated by humans about 6,000 years ago in Egypt. This was far from a fluke.
When semi-nomadic humans decided to invent agriculture and settle down in the Nile Delta, they found themselves faced with a set of survival challenges that simply did not exist in the nomadic world.
The most obvious was the gigantic pile of grain that they had every autumn as a consequence of the harvest. The granaries that held this harvest also held a year’s food supply for the civilisation that controlled it. This meant that securing the granaries was a matter of life and death.
So people built stone walls, metal swords, guard towers etc. and these were very effective at keeping other people away.
The biggest danger to the granaries was not other humans, though – it was rodents. Storing a gigantic pile of food in the middle of a large settlement of people naturally attracted mice and rats from all around.
This meant that effectively keeping mice and rats away from the granaries also became a matter of life and death.
Enter the cat.
The perfect solution to what was at the time an existential problem was found in the form of the Northern African wildcat, from which our domestic cats are descended.
The cats naturally preyed on mice and rats anyway, so it was only a matter of time until someone had the clever idea of taking some kittens into their home in the hope of domesticating them in the same ways that dogs and horses had already been “civilised”.
As anyone who has raised a kitten knows, it would have only been a matter of weeks before the kitten started chasing pieces of string and leaves, and then insects, and then the dreaded rodents.
From this moment onwards, all people capable of agriculture came to take cats into their homes for protection of their food from rodents, as cats did not eat grain themselves. And so, having cats had by this time become a crucial factor that determined one’s ability to live.
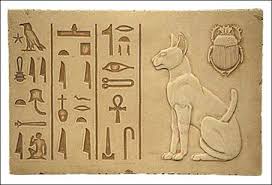
This alone was probably enough for people like the ancient Egyptians to start worshipping cats, and this would explain the curious repetition of cat-related imagery in Egyptian motifs.
Indeed, the gratitude of humans for their feline protection from rodents was initially so great that the Egyptians founded a holy city of the cat cult in a place called Bubastis. The status of the cat was so high in this culture that if a family’s cat died they could have it buried for free in the great necropolis there.
Since these times, the human population has exploded, at least in part to the initial benefits afforded by the survival advantage of not having rodents eat all of our grain.
The human and the cat might therefore have become inextricably linked. It may now be that, without cats, we couldn’t keep the rodent population low enough for us to maintain our immense population at the number it has swollen to.
It has been argued that medieval religious superstitions linking cats to witchcraft were responsible for anti-cat persecutions that led to an increase in the rodent population that led to the Black Death. So anything that harms cats, harms us.
The meow of the cat is an interesting behaviour that provides more evidence of common evolution between cats and humans, because cats do not meow to each other and they do not meow to other animals. The meow appears to be a form of communication that only exists between cat and human.
It’s possible that cats learned to meow because they evolved to. Perhaps cats that were more vocal were more favoured by humans, and so were fed more often and therefore were more capable of reproducing.
It might also be that the capacity to vocalise emotions in the form of meowing is indicative of intelligence, and that this was selected for in cats in the same way it was in humans – through increased efficiency of behaviour.
Probably the most striking piece of evidence for the common evolution of cats and humans, however, is the incredible fondness that people have for them.
This might also be an evolved behaviour. It’s easy to believe that people who were naturally fond of cats would more easily attract them as companions, and therefore benefit more from the anti-rodent efforts than a person who chased them away.
It is also easy to believe that, given the holy status of cats in some cultures, that anyone who harmed them was dealt to by other humans, and so did not pass cat-unfriendly genes into the next generation.
Unlike the horse, who was partially replaced by the automobile, and unlike the dog, who was partially replaced by remote electronic security, there will probably always be a need for cats for the sake of companionship and pest control.
It may even be that, like in the film Aliens, we take cats with us to the stars.
*
If you enjoyed reading this essay, you can get a compilation of the Best VJMP Essays and Articles of 2017 from Amazon for Kindle or Amazon for CreateSpace (for international readers), or TradeMe (for Kiwis).