In the aftermath of the Great Depression, a couple of extremely virulent and aggressive political movements swept the Western world – communism and national socialism – eventually leading to the deaths of some 50 million people. How did the Anglosphere avoid getting sucked up in these murderous, psychopathic insanities?
The soul-grinding deprivation of the Great Depression caused horrific trauma all around the world. Perhaps on account of an absence of historical guidance and precedent, a number of countries voted extremists, demagogues or lunatics into power on the grounds that desperate times called for desperate measures.
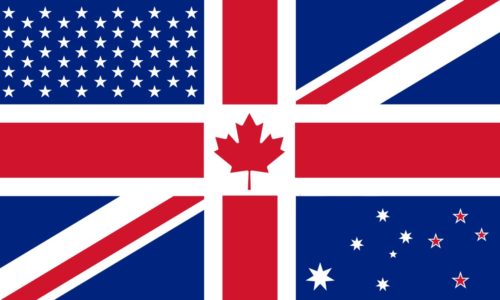
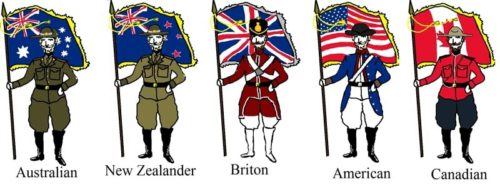
But none of the core Anglosphere nations of Britain, America, Canada, Australia or New Zealand came close to voting a totalitarian into power before World War Two, and none of them have since.
As the European Theatre of World War Two dawned, there seemed to be three major forces. The central powers, represented by Germany, Italy, Austria and Romania, were fascist; the eastern powers, represented by Russia, were communist; and the western powers, represented by the British Empire, America, France, Holland and Scandinavia, were liberal democracies.
The liberal democracies won, and won an opportunity to reshape the world in their image in the coming decades – which they mostly seized.
But ninety years after the streets of Europe were once filled with running battles between communists and national socialists, it looks like they’re going back to the same stupidity.
So why didn’t the Anglosphere put a totalitarian in power before World War Two, and why aren’t we going to put one in power in the coming decade, as the inexorable laws of demography push Europe closer to civil war?
There is a different culture in the Anglosphere. Namely: we are not a slave race, and so we do not tremble in worship before power. In fact, almost uniquely in the world (along with Holland and Scandinavia), we openly express contempt for those who wield it.
Because of this, we don’t get swept up in mass movements and personality cults like the Europeans. There is no concept in the Anglosphere of awaiting some great leader to free us from a terrible and unfortunate state of disgrace, such as which put Hitler in power. Neither is there the kind of entrenched, systematic corruption that leads to the mass resentment of the wealthy that puts Marxists in power.
In fact, if anyone stands up with even vaguely Hitler-like rhetoric, that person is immediately shut down for being a crackpot. There’s no way that you can stand on a street corner and rant about Jews without getting jeered at or having garbage thrown at you.
The trajectory of the British Union of Fascists was much different to that of the Nazi Party: “As the party became increasingly radical, however, support declined. The Olympia Rally of 1934, in which a number of anti-Fascist protestors were attacked, isolated the party from much of its following.”
Even at the apogee of British fascism, The Battle of Cable Street, a maximum of 3,000 fascists were met by 20,000 counter-demonstrators. They were even outnumbered two to one by the Metropolitan Police, which made them, at peak strength, orders of magnitude weaker than the Sturmabteilung in Germany.
And no fascist movement in America, Canada, Australia or New Zealand became anywhere near as strong as the BUF.
There seems to be an inherent wisdom in the Anglosphere consciousness that is capable of recognising massively dangerous egos and imposing a kind of order upon them before they become capable of doing too much damage. It is not in our nature to grovel before a big man; our nature is pulling the fingers, flipping the bird, saying “fuck you”.
It seems to be the natural gift of the Anglo people to keep order without the need for totalitarianism – perhaps a function of having the right amount (not too much, not too little) of diversity of thought, much like the Swedes with their lagom or the Dutch with their famous tolerance, care is taken to act with the correct proportionality.
This is probably a combination of the concept of fair play, which prevent anyone from falling too far down, and the concept of the tall poppy syndrome (Swedish: Jantelagen), which prevents anyone from developing a disruptively large ego.
Anglos generally don’t brook shadowy, sinister conspiracies like other Westerners, and are prone to instantly reject ideologies that require that human nature fundamentally be reshaped, believing in almost all cases that such a thing is simply not possible.
This column has long predicted that natural demographic laws will force Europe into a kind of civil war when Muslims in Europe realise they have the numbers to enforce their religious proscriptions on the natives. This will probably lead to the coming to power of another tyrant, because it is the nature of Europeans to swing from one extreme to another.
Whether the Anglosphere will shed the blood of its young men another time to put the European continent to order is another consideration.