The Labour Party had a rocky ride leading up to the 2017 Election, with the resignation of then-leader Andrew Little forcing a rethink of their entire electoral campaign. Despite that, their vote increased to 36.89% after the special votes were all counted, up from a dismal 25.13% in 2014. A previous article has already covered who those new voters were – this one looks at the overall group of Labour voters as a whole.
Labour voters are much poorer than the average New Zealander. The correlation between voting Labour in 2017 and median personal income was -0.52, about the same as in 2014, and shows the degree to which Labour is in favour of greater resource distribution (or at least the degree to which it gets support from those in favour of such).
There were significant positive correlations between being in any income band below $15K and voting Labour in 2017. This signifies a large change among those in the $10-15K income band – being in this band had a correlation of 0.21 with voting Labour in 2014, and had increased to 0.35 by 2017. Also, being in the $30-35K income band had a correlation of 0.15 with voting Labour in 2014, increasing to 0.27 by 2017.
Being in any of the income bands above $60K was significantly negatively correlated with voting Labour in 2017. This tells us that the idea of redistributing wealth through taxation doesn’t appeal much to the sort of people who have the most wealth.
There are a number of reasons for this connection between voting Labour and relative poverty.
One of the most obvious reasons is that Labour voters are much younger. There is a very strong negative correlation of -0.75 between voting Labour in 2017 and median age. Although part of the reason for this is that children are included in the median age statistics and that parents of young children prefer to vote Labour, most of the reason is simply because young people are poorer.
Because we already know there is a significant correlation between age and wealth we can tell that much of the reason why Labour voters are younger and poorer is simply because they have had less time to build a career or gain job expertise and this lack of seniority results in lower wages and salaries, which results in relatively stronger sentiments in favour of wealth distribution.
Labour voters are also much less educated. The correlation between having no NZQA qualifications and voting Labour was 0.34 in 2014 and 0.38 in 2017. The correlations between having no NZQA qualifications and voting New Zealand First were 0.79 in 2014 and 0.67 in 2017, so this suggests that a large number of the working class shifted from New Zealand First to Labour in the three years before the 2017 Election.
The university educated are mildly unwilling to vote Labour. The correlations with voting Labour in 2017 and having a university degree were -0.24 for a Bachelor’s, -0.22 for an Honours, -0.19 for a Master’s, and -0.17 for a doctorate. These aren’t strong – only the first of them is even statistically significant – but they’re less strongly negative than in 2014.
This mild unwillingness is probably down to two contrasting factors. Most university educated people are young because tertiary education became liberalised in recent decades and available to many more people, but on the other hand university educated people earn a lot more money than their non-educated peers, and this improved social position inclines them away from policies of resource distribution.
A third factor explaining the correlation between poverty and voting Labour is that Labour voters are much more likely to be on a non-pension benefit. The correlations between voting Labour in 2017 and being on a benefit were 0.41 for the student allowance, 0.58 for the invalid’s benefit and 0.73 for the unemployment benefit. Related to this is the fact that being a solo parent had a correlation of 0.79 with voting Labour in 2017.
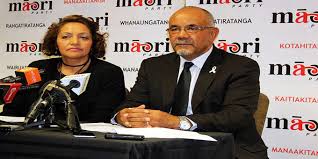
In 2017, the Labour vote correlated strongly with the votes for other parties who also have a high level of Maori support. Here the correlations with voting Labour were 0.61 for the Maori Party, 0.56 for the Aotearoa Legalise Cannabis Party and 0.41 for MANA.
Also in 2017, the Labour vote had strong negative correlations with the vote of parties full of old, white men who don’t want to redistribute resources. Most obviously was with National (-0.94) but significant negative correlations also existed with ACT (-0.62), United Future (-0.43) and the Conservatives (-0.31).
The Greens and The Opportunities Party were close to neutral in this regard. The correlation between voting Labour in 2017 and voting Greens that year was 0.11, whereas with voting TOP it was perfectly uncorrelated at 0.00.
The biggest change from 2014 was with the correlation between voting Labour and voting New Zealand First, which was 0.11 in 2014 but had become negative by 2017, at -0.15. The reason for this is mostly because of the large number of Maori voters who left New Zealand First after they said they wanted to abolish the Maori seats, and this can be seen by the change in correlations between being Maori and voting New Zealand First (down to 0.38 in 2017 from 0.66 in 2014) and between being Maori and voting Labour (up to 0.58 in 2017 from 0.42 in 2014).
Woman were significantly more likely to favour the Labour Party in 2017. The correlation between being female and voting Labour in 2017 was 0.33, slightly stronger than in 2014. As mentioned in the section about National, the reasons for this can be surmised from evolutionary psychology.
In summary, the sort of person who would vote Labour is someone in favour of greater resource distribution, which means someone with less resources than average, which means young people, the less educated, Maoris, Pacific Islanders and women.
*
This article is an excerpt from the 2nd Edition of Understanding New Zealand, which Dan McGlashan and VJM Publishing will have ready for sale at the end of October 2017. This will contain statistics calculated according to the official final vote counts and will be freshly updated with data from the 2017 General Election.