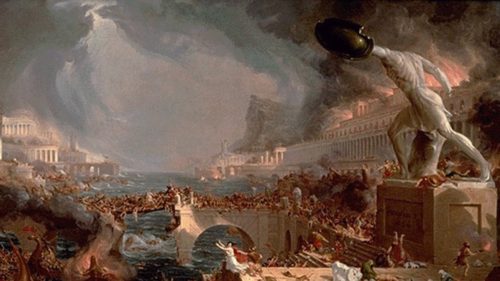
Christian culture is defined by many things; virtue signalling, slave morality, resentment, passive aggression and self hatred are the foremost of these. This Abrahamic disease of the collective consciousness was fatal for the Roman Empire before us, and, unfortunately, the Western world hasn’t been able to shake it off for nearly 2,000 years. It’s going to be fatal for us too.
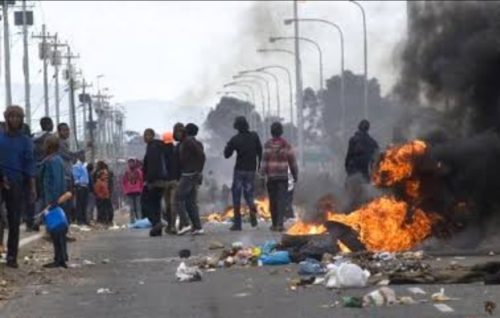
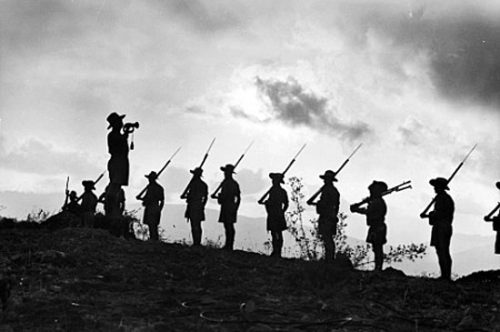
Mass immigration destroyed the Roman Empire – this is a matter of historical record. Fat, lazy and decadent, the Romans no longer had the will to defend their own Northern borders against Germanic barbarians, and that led to those barbarians having their will with the place. Free plunder resulted.
The Gothic War started in 376 when a huge number of Goths turned up on the border of the Roman Empire seeking refuge from the Huns. At first, Emperor Valens was pleased at the prospect of cheap labour for his workforce and willing soldiers (heard this story before?), but the unwillingness of the local population to support this foreign multitude of hungry mouths (what about now?) led to insurrection, and aided by traitors within the local Roman population (what about now?) the Goths were able to sack the place, leading to the eventual collapse of the Roman Empire.
All of this was made possible by the conversion of the Empire to Christianity, which turned the minds of the Romans away from reality and replaced their natural morality with the slave morality that we see expressed today in the legions of social justice warriors and cultural Marxists.
Angela Merkel is the daughter of a Lutheran minister, and her Christian morality was instrumental in her decision to open the borders of Germany to the hordes of Syrian migrants seeking refuge from people exactly like themselves.
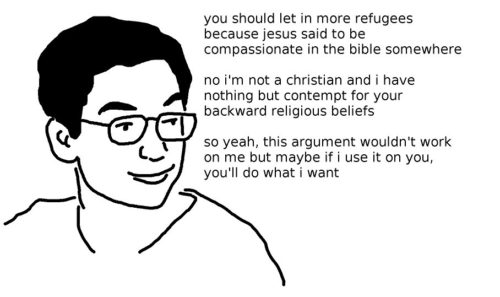
Thinking like a Christian and striving to make a show of piety, and supported by wealthy, fashionable virtue signallers, Merkel decided to allow a million Syrians to have their way with the country she ruled, on the basis that they were claiming to need help and that submitting to this invasion would be charitable.
The same catastrophe is going to happen to us, for the same reasons, and the same people will be cheerleading for it.
The immensely privileged Alison Mau used her platform in the mainstream media to let us know yesterday that we were all racists for not wanting to take hundreds of refugees, despite acknowledging that these refugees were severely mentally ill, which would require that the mentally ill New Zealanders already present go to the back of the healthcare queue to accommodate them.
Her logic is that, if you are one of the tens of thousands of Kiwis who are desperate for mental health care from a system that you have paid taxes into and which your grandparents built, you’re going to have to get to the back of the queue behind a horde of people who have not inherited a birthright to the wealth of the nation.
As Dan McGlashan points out at several points in Understanding New Zealand, this is the major division on the left, between the privileged, usually Green supporters and the unprivileged, usually Labour and New Zealand First supporters. The privileged, like Alison Mau, having enough money to protect her from the cruel vagaries of life, are happy to support whatever cause is trendy this week without care for the consequences, because the consequences of mass “refugee” resettlement will fall upon the unprivileged. The unprivileged, like the working class of New Zealand, will see the community bonds of the neighbourhoods destroyed, and the queues in front of them for getting mental health care become longer, and the security of their women and elderly start to become jeopardised.
The self-righteous Christian sentiment that expresses itself as a desire to be seen to be virtuous and compassionate will destroy the West, and it isn’t the Muslims that necessarily do all the damage. They just do enough damage to make people lose their minds, as the Jews once did in Germany. And then, all Hell breaks loose.
The real danger is not Muslims, because they are a century from being a real threat to the West. The real danger is what we ourselves might get tempted to do when the hordes of Muslim “refugees” fail to integrate, and start to achieve territorial dominance in certain areas.
A Holocaust of Muslims in Europe this century is entirely plausible – not because such a genocide is itself plausible but because all the stupid shit that leads up to one is apparently in the process of being repeated. Like the yin and the yang, the excesses of one ideology lead to the excesses of its counter, and the excess of a narcissistic desire to virtue signal one’s likeness to the ideal of tolerance and compassion as embodied in Jesus Christ will be violence.