Are the Black Caps Really a Better Test Side than the Baggy Greens?

“Just give me one that swings thanks Kane, and we’re going to No. 1.”

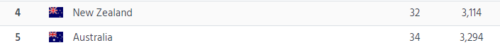
There’s something you can see right now that hasn’t been seen for thirty years. It’s not a rare comet: it’s an official Test cricket rankings that has New Zealand higher than Australia. It might come down to decimal points – both teams are on 97 overall ratings points – but the Black Caps are in fourth, the Baggy Greens in fifth. Do the Black Caps deserve to be considered a better Test side than Australia? This article has a look.

We will comparatively examine the relative strengths of either nation in the positions of established opener, junior opener, No. 3, No. 4, No. 5, allrounder, wicketkeeper, first seamer, second seamer, third seamer and spinner.

This article will compare them at all positions, championship boxing style, with an advantage in one of these positions worth a one point win and a knockdown advantage worth a two point win, to be judged along eleven rounds.

Established opener: Tom Latham vs. David Warner

On the briefest glance, this looks like a hands-down win for Warner. He boasts a Test batting average of 47.94, with 20 centuries, compared to Latham’s Test average of 38.84 with six centuries. Warner’s overall average, however, masks the stats of a home track bully.

Although Warner has a considerably higher average than Tom Latham, the two players have a similar average when batting away from home: Warner averages 36.81 away compared to Latham’s 38.46. This is the reason for Warner’s reputation as a home track bully – Latham averages about the same at home as away but Warner averages 59.12 at home.

In all, you’d probably have to give this one to Warner on the basis that he is more likely to play an innings of matchwinning destructiveness once in than Latham is, and that Latham is yet to play a definitively excellent innings against a top-flight team yet.

New Zealand 9, Australia 10

Junior opener: Jeet Raval vs. Matt Renshaw

Jeet Raval is a batsman in the style of Mark Richardson, and in a seven-Test career has functioned an average of 44, the same as Richardson. An average of 44 for a second-choice opener is incredible by recent Black Caps standards, and if Raval can keep his concentration and stick to his simple, AK-47esque simple brutality, he could be excellent in the future.

Matt Renshaw is even less established. He does have one Test century, which Raval has yet to manage, and it’s a big one: a 184 against a visiting Pakistani side this January. Apart from that, he’s not shown too much, maintaining a decent but unremarkable average of 36.64 from ten matches.

This one might be marginal, but it’s still New Zealand’s.

New Zealand 10, Australia 9

No. 3: Kane Williamson vs. Steve Smith

Steve Smith is currently at the top of the Test batting rankings, and there’s few who could really dispute that based on the numbers. He sits at 936 ranking points right now, befitting his stratospheric average of 59.66.

Unlike the days of Ricky Ponting, however, New Zealand boasts a No. 3 in the same league. Kane Williamson is not far behind Smith on the ICC rankings, at 880. Coming off a series in which he scored two hundreds in three matches against the excellent South African attack, Williamson can lay claim to being at least a pretender to Smith’s throne.

Smith is almost universally regarded as superior but here’s a curious statistic: since the start of 2015, Williamson averages 68.37 compared to Smith’s 67.79. Smith has certainly accomplished more in this time frame, but that’s primarily because he has played 15 more innings than Williamson has.

Smith has scored centuries at a marginally higher rate than Williamson during this time: 13 of them from 56 innings for a 23.2% chance per innings. Williamson has scored 9 centuries in 15 fewer opportunities than Smith, which works out to a 21.9% chance.

So in terms of who’s better right now or in the immediate future, on balance it goes to Smith but only by a whisker.

New Zealand 9, Australia 10

No. 4: Ross Taylor vs. Peter Handscomb

Over the last three years, Taylor has averaged 51.21 with the bat. That’s good enough to see him ranked 14th in the world, ahead of Tamim Iqbal, Dean Elgar and Faf du Plessis. He’s been a world-class presence at No. 4 for the Black Caps for many years, and is one behind Williamson and Martin Crowe on the all-time New Zealand Test century scorers table.

Handscomb has only played in 10 Tests, and cannot really be considered an established player. He has a 50+ average, which is very good for ten Tests, but his First Class average of 41 suggests that this will come down a fair bit.

If you consider that Ross Taylor scored the highest ever Test score by a visiting batsman to Australia – 290 in Perth – this is a knockdown win to the Black Caps.

New Zealand 10, Australia 8

No. 5: Henry Nicholls vs. Sean Marsh/Hilton Cartwright

Henry Nicholls could be considered semi-established at No. 5. He hasn’t been excellent so far in Tests – averaging 31.94 from 21 innings – but in his last series it looked like he had turned a corner. On a pitch and against a bowling attack that Kane Williamson could only manage three runs in two innings against – in the second Test against South Africa – Nicholls came in at 21/3 and played a rearguard 118 to take New Zealand from the brink of obliteration to a semi-competitive total. He’s got the goods, it’s just a question of consistency.

Australia’s choices for No. 5 are yet to show either the goods or consistency. Sean Marsh has been unable to make that spot his – despite averaging 50 there over ten innings, Marsh has scored almost everything at home, and Hilton Cartwright, heralded by many on account of his First Class average of over 50, is yet to establish himself here (or anywhere).

This one seems like New Zealand’s as well, thanks to Nicholls’s 2017 average of 48.66. This ultimately suggests that the Black Caps batting is better than the Baggy Greens batting overall. This may be the first time this has ever been true.

New Zealand 10, Australia 9

Allrounder: Colin de Grandhomme vs. Glenn Maxwell

Lord Colin de Grandhomme is now officially considered the Black Caps’ premier allrounder. In six Test matches he is yet to play a really good innings with the bat, but has on several occasions had an important impact with the ball. The most notable of these was a 6/41 against Pakistan that won New Zealand a low-scoring shootout.

Maxwell, in comparison, seems like a straight-out gamble that hasn’t paid off. Despite being one of the best pure hitters in any format of the game, he has only managed to pass 50 once in 14 Test innings. Although a batting average in the mid 20s compares favourably with what de Grandhomme has hitherto achieved, his bowling returns of 8 wickets @ 42 are much poorer than de Grandhomme’s 16 wickets @ 25.

This one goes to de Grandhomme on the basis of his bowling being considerably better.

New Zealand 10, Australia 9

Wicketkeeper: BJ Watling vs. Matthew Wade

Since the start of 2015, BJ Watling has not only given excellent service with the gloves but has scored over 1,200 runs at 42.56, with three centuries. In this regard he has been world-class for the Black Caps and probably the fourth name on the team sheet after Williamson, Taylor and Trent Boult.

Matthew Wade, by contrast, has struggled to dominate in the role and could be said to be picked by default. Over his last 10 matches he has averaged 20 with the bat and so this is fairly another knockdown victory to the Black Caps.

New Zealand 10, Australia 8

Right-arm seamer: Tim Southee vs. Josh Hazlewood

Since the start of 2015, Josh Hazlewood has taken 109 wickets @ 25, cementing him as one of the world’s premier Test bowlers. Only Jimmy Anderson is ahead of him of seamers on current rankings, and it’s easy to see how Hazlewood’s mean accuracy and unpredictable bounce has him at the top here.

By every measure, this is a long way ahead of what Tim Southee has achieved. Southee has 70 wickets @ 34 since the start of 2015, with the only truly matchwinning performance a six-wicket bag to destroy Pakistan’s first innings in Hamilton in 2016.

Southee, even with all his experience, is a much weaker bowler than Hazlewood and Hazlewood is still improving so this would have to go down as a knockdown victory to Australia.

New Zealand 8, Australia 10

Left-arm seamer: Trent Boult vs. Mitchell Starc

Mitchell Starc and Trent Boult have a similar career bowling average of about 28 runs per wicket. Starc has, however, been much stronger over the past 3 years. Since the start of 2015 he has taken 103 wickets at under 25 per wicket.

Boult has still been very good, with 84 wickets @ 30, wrecking England twice, Australia once and South Africa once during that time. One also gets the feeling that he has been unlucky recently, with long periods of sustained pressure inexplicably not ending with wickets.

In the end, though, Starc has a legitimate claim to world-class status whereas Boult is probably at the level below still.

New Zealand 9, Australia 10

Third seamer: Neil Wagner vs. Pat Cummins

Neil Wagner is the highest-ranked Black Caps Test bowler at 10th place. It’s easy to see why – since the start of 2015 he has taken 72 wickets at 24.41, with a sub-50 strike rate. Unlike his teammates Boult and Southee, Wagner doesn’t need as much assistance from the conditions to be effective, and he’s a genuine weapon anywhere.

Pat Cummins is an excellent bowler, but it’s not clear that we’ve seen enough of him to argue that he’s better than Wagner. He came back to the Test arena this year after six years of injury-enforced layoff, and he looked good in taking 14 wickets at just under 30.

Perhaps in five years Cummins will be decisively ahead on this count, but for now Wagner has much more proven effectiveness.

New Zealand 10, Australia 9

Spinner: Mitchell Santner vs. Nathan Lyon

This one is interesting because Santner is clearly the better batsman and Lyon clearly the more effective bowler, it’s just a matter of how to split the balance.

Lyon averages 28.73 with the ball since the start of 2015, with 135 wickets and a couple of Man of the Match efforts in there. This is only three runs per wicket more than Shane Warne averaged, but in a more batter-friendly era. Santner, by contrast, averages just under 40 with the ball and has only claimed 31 wickets so far.

Santner does however average 26 with the bat. Lyon, by contrast, is a genuine tail-ender, with a high score of 40 from 69 Tests and an average of 11.

In the end, you have to say that bowlers are there to bowl, not to bat, and so Lyon’s advantage here ought to be decisive in his favour.

New Zealand 9, Australia 10

Summary: New Zealand 104, Australia 102

Even if it’s agreed, on the basis of the above analysis, that the Black Caps are stronger at Tests than the Baggy Greens, the margin is extremely slim. The Black Caps might be genuinely stronger with the bat, for the first time in the history of Test cricket, but both of the Australian opening bowlers are stronger than their Kiwi counterparts and so is their spinner.

In the Australians’ favour it could be argued that good bowlers are more important than good batsmen and so the difference between Hazlewood and Southee ought to weigh heavier than the difference between Taylor and Handscomb.

If the two sides would play each other on neutral soil in a Test match now there might be a slight advantage to the Black Caps. That there might be a slight advantage is the most you can really say.

Thoughts of a Luciferian Occultist on the Occasion of His 36th Birthday

My life has been divided into four nine-year blocks that correspond to the four masculine elements of clay, iron, silver and gold. This has culminated in my own apotheosis as someone who no longer fears the death of the physical body. Such thoughts became apparent to me when I marked the occasion of having been around the Sun thirty-six times, and reflected upon the wobbly path that was taken.

The phase of clay, representing the first nine years, was when simple survival skills were learned. This phase is shared by all creatures that need to survive, right down to the dumbest herbivore. This is the phase that we are born into, one that is characterised by fear as we learn to balance our innate curiosity with staying away from dangers.

In the first nine years of my life I was little different to a sheep or chicken. Essentially all actions I took were reactions. Usually I was guided along by well-meaning adults, and usually I had no reason to not comply. In this phase a basic civilising process took place, and I learned to enjoy life.

The alchemical culmination of this phase is tin, which corresponds to the planet Jupiter. Like Jupiter, it is large, larger-than-life in some ways. It’s bombastic and narcissistic but it is grounded in a healthy affirmation of life and therefore is necessary before the next phase can begin.

The iron phase began when I learned to take competitive sport seriously. Here the enjoyment of life becomes strong enough that a desire to challenge oneself and others arises. This happened at about the same time as puberty began, and with that came a desire to kill other males.

This is the phase when it becomes useful for a child to learn a martial art, or when it becomes enjoyable to seriously develop a set of skills for a competitive sport. Fittingly for iron, during this phase I became a harder individual, but in becoming so I also became a more useful one, in the same way that tools of iron are much more useful than tools of clay.

Its apogee was an incident on a rugby field where I hit an opposing ball carrier so hard in a tackle that I broke my own collarbone on impact and was knocked to the ground. He and I had developed a grudge over the course of the game, hitting each other harder and harder in tackles to try to show off who was strongest. I was about 15kg lighter than him and resorted to a shouldercharge to make up for it.

Unfortunately, he saw he coming and put the shoulder in himself, and I came off second-best (in an odd coincidence, that player, Simon P. Murphy, went on to become the author of His Master’s Wretched Organ, published by this company!).

The incident taught me to appreciate the limits of the sphere of iron. It was effectively where I learned the limitations of aggression and violence, and that knowing how to guide aggression intelligently was much more important than sheer volume of aggression.

It represented a softening to something of greater value, and this was represented alchemically by the phase of silver. This was also where I learned the value of intelligence. On the rugby field it didn’t seem like intelligence was worth much, as it appeared to me mostly about strength. But knowing how to direct one’s strength, not strength itself, was the real ability of value.

This phase began around age 18 and involved going to university. At university it is expected that one has gotten over the testosterone-fueled dominance battling of the phase of iron and therefore that one can work on polishing oneself up.

For me, embarking on the path of silver began with a Bachelor’s degree in psychology, and with losing my virginity to a Swedish nursing student. Upon managing both of these things I developed an appreciation for what intelligence had to offer the world.

I learned to use my own intelligence to go travelling and work around the world, spending three years in Europe and a year in other foreign climes. During this time I learned a few languages, and upgraded my education to a Master’s degree, and by the end of this nine-year block I was capable of thinking logically and rationally.

Being able to think intelligently is an ability that dazzles those still on the level of iron or clay, and as such it corresponds to the reflective ability of sunlight off a mirror. But intelligence itself is not, by itself, necessarily an expression of the will of God.

The silver became, in itself, more alive, and this moved me into the realm of mercury. This was represented in the material world by doing a lot of bar work. Here I learned to become silver-tongued, and to crack jokes, and to parry insults into harmless banter, and to be glib and slick and easygoing.

Seven grams of psilocybin mushrooms, taken shortly after I turned 27, marked the end of this phase of silver and mercury. These I had been given by a hippie workmate upon expressing to him what I felt to be the mental health benefits of smoking cannabis, especially for someone like me who had long suffered problems from nausea and insomnia.

I recall, at the peak of the trip, standing before God and being asked how much I thought I could handle, and replying that I wanted the full measure. In that moment I became entirely reunited with God and understood that I was forgiven for all errors, past and future.

This experience obliterated my mind, and taught me that everything I knew was wrong. I had been granted a glimpse into the face of the divine, but because of my ego and attachment to false self I was not immediately able to manifest the knowledge that I had been granted in my everyday life.

I had two options: to abandon the shamanic path and dismiss the insights gleaned from psychedelics as delusions and insanities, or to accept the challenge of the phase of gold.

I accepted the challenge of the phase of gold, and this involved a willful refusal to allow myself to forget the insights that I had been granted at the peak of the mushroom trips, such as an insight into the true nature of consciousness, or the fact that the contents of consciousness could be represented as a Great Fractal.

The culmination of this phase was writing a manuscript called The Pyrrhonist, an exercise in questioning reality from first principles. This caused the complete disintegration of my entire personality and of everything I believed to be real. I systematically questioned every belief I had, even the most fundamental, and by the end of that process I had questioned the fundamentals of reality so thoroughly that I was mad.

At the nadir of this phase I spent ten days in a mental health unit.

This dark night of the soul served as an nitric acid, dissolving all of the less pure elements of my soul; I was completely humbled. I was forced to stand before the judgment of God and concede that the maintenance and preservation of my ego was a fool’s errand – not only did I make myself less happy, but everyone who encountered me got less out of it than they otherwise would have done.

At this point I had been completely broken, and was ready to rebuild.

This took another three years or so, and involved a kind of self-nurture that, ironically, I had been too selfish to previously allow myself, lest the softness made me weak. It also involved smoking a tremendous amount of cannabis, for the reason that this medicine prevented the pull of the body from dragging my frequency back down to clay because of pain and nausea.

I had to learn to accept that I was not and could never be judged by ephemeral concerns. I embarked on an attempt to purify my soul, which involved abstinence from all of tobacco, alcohol and women.

This last of the four nine-year blocks of my life ended this week, upon turning 36. It ended with my acceptance of the fact that I feel entirely at peace and that there is nothing, fundamentally to fear. I am absolved of all sin and can take my part in the play.

This, I feel, is the lesson of the element of gold. It cannot shine directly on people, in the manner of silver, because where people become blinded and dazzled by silver they become humbled by gold, and in being humbled they become resentful, and in becoming resentful they become destructive.

Gold, being the softest of all metals, can least tolerate that destructive will, and so it has to learn to be subtle. Its essence is therefore gentleness and precision. Working on the level of gold means learning to influence on the level of spirit, not just the level of mind (as is silver).

I feel that now, at age 36, a certain alchemical process has come to its end and that now I can live on whatever level of clay, iron, silver or gold is necessary for the environment that I am in, now that I know how to tune into the appropriate frequency.

Where the Green Vote Collapsed From 2014

The Green Party has, by far, the best looking women, but that couldn’t prevent their party vote from collapsing at the 2017 General Election

The Green Party vote collapsed at the 2017 General Election compared to 2014. They got 10.7% of the total party vote in 2014, but could only manage 5.9% in 2017 (although this may rise slightly on specials). This article looks at who abandoned them over the three years from 2014.

The largest, most immediate clue is that the average Green voter was much poorer this year than they were in 2014. The correlation between median personal income and voting Green in 2017 was 0.03, compared to 0.31 in 2014. This means that, from being about as wealthy as the average ACT voter, the average Green voter is now about as wealthy as the average Kiwi.

If we look at educational achievement and voting Green, there is evidence that the Greens were completely abandoned by the university-educated crowd.

The correlation between voting Green in 2017 and having a Bachelor’s degree was -0.09, with having an Honours degree it was -0.08, with having a Master’s degree it was -0.09 and with having a doctorate it was -0.08. These figures represent a drastic reversal of the strong positive correlations between voting Green in 2014 and having a Bachelor’s degree (0.57), an Honours degree (0.75), a Master’s degree (0.64) or a doctorate (0.67).

A further strong clue comes from looking at the voting patterns of professionals. Working as a professional and voting Green in 2014 had a very strong correlation of 0.73, but by 2017 this had collapsed, to -0.10. There was a corresponding collapse in the correlations between working in professional, scientific or technical services and voting Green – from 0.63 in 2014 to -0.09 in 2017.

As referenced in a previous article, the vast majority of these voters went to The Opportunities Party in 2017.

The other interesting change was that the Greens won a lot more working class Pacific Islander support than previously.

The correlation between being Maori and voting Green was virtually the same in 2017 (-0.08) as what it had been in 2014 (-0.09). However, the correlation between being a Pacific Islander and voting Green went from a significantly negative -0.27 in 2014 to an almost uncorrelated -0.07 in 2017.

It’s possible that the Greens won a lot of sympathy from working-class brown voters in the wake of middle New Zealand ripping into Metiria Turei during her WINZ scandal, but that the Maori half of those voters preferred Labour in the final analysis.

Essentially what these numbers suggest is that the Greens hemorrhaged the support of the professional class to TOP, but won the support of a fair number of working class Pacific Islanders who probably felt sympathy with Metiria Turei during her trial and execution by the mainstream media machine.

This explains how the Greens suddenly became a much more Christian party than they used to be. When they still got the support of the mostly atheist professional class, in 2014, the correlation between being Christian and voting Green was -0.57. In 2017, after being abandoned by this professional class and welcomed by working-class Pacific Islanders, who are frequently religious, the correlation between being Christian and voting Green had actually become positive, at 0.21.

That many of these new Green voters were Pacific Islanders can also be seen from the fact that industries with a high Pacific Islander workforce component tended to switch to them. The correlation between working in the postal, transport and warehousing industry and voting Green became markedly less negative, from -0.29 in 2014 to -0.01 in 2017, and there was a complete flip in the correlation between working in manufacturing and voting Green, from -0.49 in 2014 to 0.23 in 2017.

It could be that the Greens lost much of their forward-thinking professional class to TOP but, in doing so, flattened out their bias towards the wealthy and the educated and became more of a mass socialist party that found a voice among those at the bottom.

This theory is supported by the voting patterns of age in the 2017 election. In 2014, the correlation between voting Green and being aged 20-29 was strong, at 0.56. By 2017 it had fallen to -0.05. This collapse was the most brutal suffered by the Greens from 2014, and represents their total abandonment by the most trendy and fashionable segment of society.

Tellingly, the correlation between being aged 5-14 and voting Green increased sharply, from -0.42 in 2014 to -0.08 in 2017. Obviously, children cannot vote but this tells us that young adults who were yet to have children (that aspiring professional class) were heavily represented among those who left the Greens after 2014.

Some might be interested to note that the correlation between working for a wage or salary and voting Green dropped from 0.41 in 2014 to 0.10 in 2017. This more than anything shows the extent to which the Greens of 2017 represent the working-class brown family more than they do the professional white childless urban couple.

*

This article is an excerpt from the 2nd Edition of Understanding New Zealand, which Dan McGlashan and VJM Publishing will have ready for sale at the end of October 2017. This will contain statistics calculated according to the official final vote counts and will be freshly updated with data from the 2017 General Election.

Which of Labour or National Shares the Most With New Zealand First Demographically?

Is has been argued that Winston Peters ought to go with whichever side is most like New Zealand First demographically – but which is it?

There are many competing reasons for thinking that Winston Peters ought to go with one or the other of Labour or National in the post-election negotiations to form a Government. Some say that any arrangement with the Greens involved will not be stable enough, some say that the Opposition parties won a clear majority and therefore a mandate for change, some say that Winston will go with whoever he feels like going with. This article, by Understanding New Zealand author Dan McGlashan, looks at things another way.

We will follow here the argument that Peters ought to side with whichever out of Labour and National represents the people most similar to their own, and to that end this article will make a judgment using six major demographic categories, viz. age, ethnicity, education, income level, gender and homeownership rates.

Age

The correlation between voting National in 2017 and median age was a very strong 0.77, which represents the old people who own everything, and between voting Labour in 2017 and median age it was -0.66, which represents the people who are yet to become financially established and are living primarily on their wages.

The correlation between voting New Zealand First in 2014 and median age was negative, at -0.08, but by 2017 it had become significantly positive, at 0.24. This is primarily because of a large number of young, working-class Maoris shifting to Labour.

Young people drifted away from New Zealand First this election, and old people drifted in. The correlation between being aged 20-29 and voting New Zealand First was -0.38 in 2014 but had become -0.60 by 2017, whereas the correlation between being aged 65+ and voting New Zealand First was 0.10 in 2014 and had become 0.36 by 2017.

Young voters tend to not like either National or New Zealand First, whereas elderly voters like both, so that suggests a greater age overlap with the National Party. Decisively, the correlation of 0.24 between voting New Zealand First in 2017 and median age is 90 basis points away from the Labour figure, and only 53 basis points away from the National figure, so National win this one.

National 1, Labour 0

Ethnicity

The stereotype is of New Zealand First as an old, white, racist’s party, which is a very odd perception when it’s led by someone who played for the Auckland Maori rugby team. The truth is much more complex.

Voting New Zealand First in 2014 and being a Kiwi of European descent was perfectly uncorrelated, at 0.00. Between voting New Zealand First in 2014 and being Maori the correlation was a strongly positive 0.66. That means that at the time of the last election, the stereotype of New Zealand First voters was entirely false.

Some truth crept into it in 2017, however. By 2017 the correlation between being a Kiwi of European descent and voting New Zealand First had risen to 0.19, whereas the correlation between being Maori and voting New Zealand First had fallen to 0.40. This means that New Zealand First is still more of a Maori party than it is anything else, but that sentiments of white Kiwis are also well represented.

The correlation between being a Kiwi of European descent and voting National in 2017 was a strong 0.51, and for voting Labour it was correspondingly weak, at -0.56.

This means that New Zealand First is slightly more like National when it comes to whiteness, but far more like Labour when it comes to Maoriness. The correlation between being Maori and voting National in 2017 was a strongly negative -0.68, whereas the figure for voting Labour in 2017 was, at 0.57, very close to the New Zealand First figure.

New Zealand First was fairly to similar to National in that their party was mildly disfavoured by Pacific Islanders, in contrast to Labour. The correlations between being a Pacific Islander and voting National or New Zealand First in 2017 were -0.35 and -0.17 respectively, very different to the correlation between being a Pacific Islander and voting Labour, which was, at 0.57, as strong as the one with being Maori and voting Labour in 2017.

This is unlike the case of Asians, who were moderately more likely to prefer National to Labour, and who despise New Zealand First. The correlation between being Asian and voting National in 2017 was 0.10, only a smidgen stronger than what it was in 2014. Between being Asian and voting Labour in 2017 it was -0.09, but between being Asian and voting New Zealand First in 2017 it was -0.58.

All in all, if you weight each ethnicity by the number of Kiwis belonging to it, it’s more or less a draw.

National 1.5, Labour 0.5

Education

Labour shares with New Zealand First an affinity from those with few NZQA qualifications. New Zealand First was by far the most poorly educated voting bloc in 2014, and, although it’s true that they still are, the margins became smaller.

The correlations between having no NZQA qualifications and voting New Zealand First or Labour in 2017 were similar, at 0.69 and 0.45 respectively, and very different to that of having no NZQA qualifications and voting National in 2017, which was -0.32.

This isn’t really surprising because someone with no NZQA qualifications is not likely to have a large income or a number of rental houses, and so will not benefit from National’s refusal to institute a capital gains tax, and they are very likely to be living hand to mouth or close to it, which means they lost out from the rise in GST to 15%.

Some will be very surprised by the voting patterns of the highly educated, though. On the one hand, it might not be surprising that the university educated were mildly disinclined to vote Labour in 2017. The correlations with doing so were -0.32 for people with a Bachelor’s degree, -0.28 for people with an Honours degree, -0.27 for people with a Master’s degree, and -0.21 for people with a doctorate.

But neither were they particularly inclined to vote National. The correlations with voting National in 2017 were 0.15 for having a Bachelor’s degree, 0.10 for having an Honours degree, and 0.09 for having either of the two highest degrees. As it turns out, a large number of these people voted TOP, ACT or Green.

Compared to their sentiments towards Labour and National, university graduates are extremely disinclined to support New Zealand First. The correlations between voting New Zealand First in 2017 and having a university education was -0.73 in the case of having a Bachelor’s degree, -0.69 for an Honours degree, -0.74 for a Master’s degree and -0.60 for a doctorate.

This suggests that neither Labour or National have much in common with New Zealand First educationally, but Labour does share with New Zealand First a supporter base of very uneducated people. This is worth three-quarters of a point to Labour and one quarter to National.

National 1.75, Labour 1.25

Income

Leaving aside the truly broke, who know that their bread is buttered with Labour, not National, and who are indifferent to New Zealand First, voters in every income band are about equally likely to prefer Labour and New Zealand First to National.

The most wealthy Kiwis dislike New Zealand First even more than they dislike the Labour Party, which is perhaps a commentary on how the Labour Party supports the wealthy by way of supporting neoliberalism.

People with an income of $150K+ had a correlation of 0.24 with voting National in 2017, -0.43 with voting Labour in 2017 and -0.51 with voting New Zealand First in 2017, and those with an income of $100-150K had a correlation of 0.26 with voting National in 2017, -0.40 with voting Labour in 2017 and -0.54 with voting New Zealand First in 2017.

This suggests that the people who are creaming it the most look at Labour and New Zealand First with a similar level of disdain.

People in the $50-60K income band were almost perfectly indifferent to all three parties. The correlation between being in this income band and voting National in 2017 was 0.01, with voting Labour in 2017 it was -0.03 and with voting New Zealand First in 2017 it was 0.04.

This tells us that people in the middle – either the young, poor, ambitious and going up or the old, middle-class, satisfied and looking to hang on – wouldn’t really mind which way Peters went.

The people in the working-class income bands between $25 and $40K, in contrast to those in the $100K+ income bands, look at Labour and New Zealand First with a similar level of approval.

Kiwis earning $35-40K had a correlation of 0.49 with voting New Zealand First in 2017, which is much closer to the correlation between being in this income band and voting Labour in 2017 (0.38) than it is to the one between being in this income band and voting National in 2017 (-0.37).

In the income bands lower than this, people tended to support New Zealand First all the more. To the poorest New Zealanders, there is no apparent difference between National and Labour, and such a mindset seems to find a home in New Zealand First.

Ultimately, wealthy Kiwis like National and dislike Labour and New Zealand First, and poor Kiwis dislike National and like Labour and New Zealand First, so this one goes to Labour.

National 1.75, Labour 2.25

Gender

The correlation between voting National in 2017 and being male was 0.23, understandable as men earn more money than women and are therefore relatively likely to lose from the balance of taxation and welfare spending.

The correlation between voting Labour in 2017 and being female was 0.40, also understandable for the opposite reasons to why the men vote National – women earn less money and therefore benefit more from a party that raises taxes for the sake of social spending.

New Zealand First voters fell right in the middle. The correlation between voting New Zealand First in 2017 and being female was 0.10, which placed it almost exactly as far away from the National figure as from the Labour one.

In other words, New Zealand First voters were slightly more likely to be female, which fell in between National’s moderately more likely to be male and Labour’s strongly more likely to be female.

National 2.25, Labour 2.75

Homeownership

Curiously, the correlations between living in a mortgaged house and voting in 2017 for any of the three parties under discussion were basically identical. For National and Labour it was both 0.16, and for New Zealand First it was 0.14.

For living in a freehold house, things were a bit different. Predictably, people who lived in freehold houses were much more likely to vote National than Labour. The correlation between living in a freehold house and voting for National in 2017 was 0.65, and with voting for Labour in 2017 it was -0.51.

But people who voted New Zealand First fell almost right in the middle – the correlation between living in a freehold house and voting New Zealand First in 2017 was 0.22. This might be marginally closer to National but this was not the case in 2014. At that election, voting for New Zealand First had a correlation of -0.05 with living in a freehold house.

A similar pattern presented itself for those who were renters. The correlation between living in a rented house and voting for National in 2017 was a very strong -0.79, and with voting for Labour in 2017 it was also fairly strong, but in the other direction, at 0.56.

Again, New Zealand First voters fell in the middle. The correlation between living in a rented house and voting Nw Zealand First in 2017 was -0.26, which again falls right in between Labour and National. This one has to be another tie, at half a point each.

Final score: National 2.75, Labour 3.25

In the final analysis, it would be far from easy for Peters to choose between Labour and National on the basis of demographic similarities. Age would push him towards National, income towards Labour, and gender and homeownership rates would be even.

This makes for a very strong negotiating position in one sense. Unlike the Green Party – who cannot support National without committing suicide in the manner of the Maori Party and the British Liberal Democrats – New Zealand First could plausibly support either Labour or National, meaning that either side has an incentive to offer as much as it can to them.

However, Winston Peters has also been forked. He has to make one group of committed New Zealand First supporters unhappy. Either he makes the elderly European contingent unhappy by going with the Green Party, or he makes the working-class Maori contingent unhappy by going with National.

No doubt this calculus means that Peters will take his sweet time, and consider every possibility, before deciding on whose head he will place the crown.

*

This article is an excerpt from the 2nd Edition of Understanding New Zealand, which Dan McGlashan and VJM Publishing will have ready for sale at the end of October 2017. This will contain statistics calculated according to the official final vote counts and will be freshly updated with data from the 2017 General Election.