
Understanding New Zealand: National Voters

If National are the current governing party it is because they are the most popular, and if they are the most popular it stands to reason that understanding them will bring us a lot of insight into New Zealand. This article is a statistical analysis of the sort of person who kept the National Party in power during the 2014 General Election.

The simplest way to describe National voters is as the opposite of Labour ones. Generally they are wealthy, and wealth more than anything is what defines the National voter. The correlation between Personal Income and voting National in 2014 is 0.53, much stronger than it is for voting for any other party. Even ACT, stereotyped as the party of big business, has a correlation with Personal Income of only 0.36.

By being wealthy, National supporters naturally tend to feel that the control system is there for their benefit and to protect them. This explains why voting National in 2014 has a strong correlation of 0.76 with Turnout Rate. National Party supporters vote, vote and then they vote some more. A turnout rate of 0.76 means that even the thinnest conservative sentiment will see their supporters come out and vote, rain or shine.

Also by being wealthy, voting for National in 2014 tends to correlate with other correlates of wealth. With voting National in 2014 and Median Age the correlation is a very strong 0.81, which reflects the well-known phenomenon that turnout rate declines sharply the younger the demographic one looks at. Old people love to vote, and they love to vote conservative.

Although voting for National in 2014 is significantly negatively correlated with having no academic qualifications (-0.43) there is no significant positive correlation between voting National in 2014 and having a Master’s degree. As there is a significant positive correlation between having a Master’s degree and both voting Greens in 2014 (0.64) and voting ACT in 2014 (0.57) this might be difficult to understand until one realises that the National Party is the party of inherited wealth and class.

This is evident from the fact that Asians, who are more likely to be recent immigrants and thus less likely to inherit wealth from grandparents etc. (and who correspondingly have a non-significant correlation with Personal Income of 0.22 compared to the European 0.35) do not have a significant correlation with voting National in 2014 (0.09) but have an extremely strong correlation with voting ACT (0.85).

This reflects the foundational split on the right wing: if you want to start a business you tend to vote ACT; if you want to charge rent or inherit you tend to vote National.

This is evidenced by the fact that, although the correlation between voting National in 2014 and voting ACT in 2014 was significant, it was a weak 0.35. This is much weaker than the correlation between voting National in 2014 and voting Conservative in 2014, which was 0.77.

Another point of note is that while voting National in 2014 obviously has a very strong negative correlation with voting Labour in 2014 (-0.85), the strength of the negative correlation is greater between voting National in 2014 and voting New Zealand First in 2014 (-0.34) than it is between voting National in 2014 and voting Green in 2014 (-0.19).

This is probably because National and Green supporters share significant similarities that they do not share with New Zealand First voters, namely being white and wealthy. The correlation between voting National in 2014 and being of European descent is 0.60, whereas for Maoris the correlation is -0.75 and with Pacific Islanders it is -0.46. This pattern is similar with the Greens, who also attract Europeans and repel Pacific Islanders.

Interestingly, the correlation betwen voting New Zealand First in 2014 and being of European descent is a perfect 0.00 – which tells us that the National Party, in so far as it maintains class privilege, actually maintains the racial privilege that correlates with it much more aggressively than New Zealand First, although the latter is stereotyped as the party that attracts racial supremacists.

Those readers unfamiliar with this newspaper might be surprised at the massive correlation between voting National in 2014 and voting to change the flag in the second flag referendum: a whopping 0.95.

Considering that the correlations between voting National in 2014 and Turnout Rate in the first flag referendum (0.86) and the second flag referendum (0.83) were also very strong, it’s fair to say that the whole flag referendum project was pretty much a National Party vehicle (one that was perhaps intended to distract from more pressing issues).

*

This article is an excerpt from Understanding New Zealand, by Dan McGlashan, published by VJM Publishing in the winter of 2017.

The Real Media War is the Mainstream Media vs. You

noamchomsky

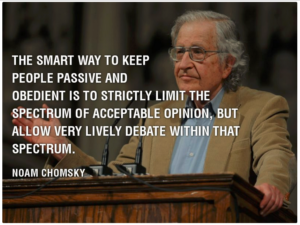
Noam Chomsky said something very intelligent once, quoted in the above image. It’s an extremely perceptive insight because it lays bare at a stroke one of the most powerful tools of deception that the Hate Machine has to levy against you.

The corporate media is very skilled at creating the impression that the war between truth-tellers is a war between TV1 and TV3, or between Stuff and Newshub.

In reality, it is a war between those who seek to force you into that claustrophobic little paradigm of thought that Chomsky referenced, and the rest of us.

An insight into how this works can be gleaned from observation of the incestuous nature of the mainstream media. On Stuff, for example, many of the articles are simply puff pieces that reference other mainstream sources of media, in particular television, the pleb’s choice of medium.

This probably isn’t surprising once you consider that the majority of the New Zealand media is owned by a small number of foreign billionaires. If you own both a television station and a newspaper, then why not direct your newspaper to write about the shows on your television station?

This collaboration is in principle little different to how the major bookstores work in concert to act as gatekeepers for any book or publisher whose message does not serve corporate interests (which is why you don’t find David Icke and VJM Publishing books in Whitcoulls or Paper Plus).

They will say it’s a matter of economy of scale but this dodges the point, because there will always be more money in pandering to the lowest common denominator, which has been true for a long time.

This newspaper warned at the time that the flag referendum was a deliberate waste of time and energy intended to distract us from making progress on real social issues. Predictably, this warning was not heeded by the masses, who indeed wasted many months of time and energy deciding which flag would ultimately be rejected in favour of the status quo.

The accuracy of Chomsky’s headline quote is very evident if one studies the message of the New Zealand media during that period. They presented a meaningless choice between a range of already doomed options, and then simply refused to discuss anything else.

And then, a few months later, they simply did it all again: excluding all political debate of any national significance so that John Key’s hubristic charade could be front and centre.

The end price of $26,000,000 was a win-win-win for the National party: they successfully hamstrung any meaningful debate about the state of society for months, and they made us pay for it, while at the same time cutting access and funding to social services.

The real media war is between those who want to inform you (out of solidarity) and who want to confuse, frighten, mislead and befuddle you (usually out of a profit motive). So if you have a piece of information that is of more value than the average mainstream media puff piece about Max Key or Kate Middleton, then share it.

How Much in Taxes Would New Zealand Make From Legal Cannabis Sales?

With the repeal of cannabis prohibition rising higher and higher in the national consciousness, it seems like a good time to assess the economic impact of a change. The figure of $180,000,000 per year has been touted as the potential savings from a repeal, but how much tax revenue would it bring in?

The paper linked above suggests that the figure ought to be around $150,000,000 per year, but an argument can easily be made that it ought to be more.

In the first ten months of 2016, Colorado sold over USD1,100,000,000 of cannabis. This figure was so high that the total tax receipts for 2016 on cannabis sales in Colorado look set to be more than those for 2014 and 2015 combined.

USD1,100,000,000 over ten months works out to USD1,320,000,000 over twelve months or NZD1,830,000,000 at the current exchange rate. Colorado has a population of 5,400,000 compared to New Zealand’s 4,700,000, which means that New Zealand is 87% as populous as Colorado. Assuming that the total cannabis sales per person is equivalent in New Zealand and Colorado, we can assume from this that the market in New Zealand would be 87% of the Colorado one, or $1,592,100,000 per year.

Rounding this to $1.6 billion, we come to the figure of about $340 per person per annum. Hardened stoners might scoff at this figure, as it represents about one ounce per year, and New Zealand very likely has more hardened stoners than Colorado, but let’s assume this represents a conservative lower figure.

Simply taking 15% GST on this volume gives us $240,000,000 per year. So it’s fair to say that the $150,000,000 touted above is a very, very conservative figure.

This figure of $240 million is assuming that cannabis is not subject to some kind of vice tax in the way that alcohol and tobacco are. In Washington, the State Government took a 40% cut of the total sales.

The Washington market is not as well developed or planned as the Colorado one, and is thus much smaller. But if the New Zealand market developed like Colorado, a 40% tax would (even allowing for a 10% reduction in total sales on account of the tax) reap $500,000,000 per annum.

The likelihood is that someone on the Government side will end up making the argument that legal cannabis will reduce legal alcohol sales and thus alcohol tax income, and therefore a vice tax will have to be placed on legal cannabis to make up for the shortfall.

The majority of the country will find this logic entirely reasonable, which is in fact regrettable but this is outside the scope of this article. It will probably get pushed through.

In any case, the chances of a cannabis tax up to or even exceeding Washington’s 40% are very real, as New Zealand has a lot more inbred, out-of-touch, sanctimonious wowsers than Washington.

Realistically, then, we could count on tax money from a mature legal recreational cannabis market bringing in half a billion to Government coffers every year. This figure would be considerably higher if we did so now and got the jump on Australia, as there are legions of Aussies who would happily fly a few hours to New Zealand for a weed holiday.

The Future of Trans-Tasman Domestic Cricket

It’s perhaps fitting that cricket, the most traditional of all major sports in New Zealand, is the only one yet to jump on the Trans-Tasman bandwagon. League, union, netball and soccer all operate in Australian leagues at the highest domestic level. It seeems inevitable that the same will happen for cricket, so, what will it look like?

The concept of a Trans-Tasman domestic cricket league was a fantasist’s pipedream during the era of 50-over domestic cricket. But the idea has had new life ever since the advent of serious, high-quality, T20 domestic cricket.

Domestic cricket has hitherto had one immense hurdle, and that was the difficulty in getting punters to sit in a stadium for the duration of a cricket match when it wasn’t the top level of skill available. They will do it if the sport has matches of a shorter duration, and they will do it for long duration, top level cricket, but not long duration domestic cricket.

T20 fills both of those gaps. A domestic T20 match offers punters a chance to see a high level of cricket without making a time commitment of an entire day (or longer). The Indian Premier League has muscled into a space on the cricket calendar and it seems like it’s here to stay.

This column has taken the time to get caught up in some of the Big Bash League hype last summer. Frankly, it’s a very high level of cricket. Australia has to fit much more talent into a handful of domestic teams than the New Zealand system, and a consequence of this is a level of cricket somewhere between international level and New Zealand domestic level.

The BBL currently has eight teams, which corresponds to one team per two and a half to three million people. Probably, however, there are plans to expand, as the BBL is still in its infancy. If it is expanded to a similar size to the Trans-Tasman tournaments in other sports there would be room for two or three Kiwi teams in a league of 16 to 18.

Two might be difficult as the natural division into North and South Islands would leave a Northern team representing over three times the population of the Southern team.

Perhaps the best would be to divide New Zealand into North, Central and South. This would be very simple as it would mean Northern Districts and Auckland were North, Central Districts and Wellington were Central, and Canterbury and Otago were South.

Perhaps in the very long term we might end with a Super Rugby style arrangement of three Kiwi teams, seven Aussie teams for each state and five or six South African ones.

Three Kiwi T20 teams might leave us with something that looked like this. The Northern team isn’t far off international standard in its own right, but the other two are currently a fair bit weaker and might need to draft in overseas players to fill some gaps.

Northern:

1. Martin Guptill
2. Kane Williamson (c)
3. Dean Brownlie
4. BJ Watling (wk)
5. Corey Anderson
6. Colin Munro
7. Mitchell Santner
8. Tim Southee
9. Mitch McClenaghan
10. Lockie Ferguson
11. Trent Boult

Central:

1. Ben Smith
2. Ross Taylor (c)
3. Tom Bruce
4. Will Young
5. Tom Blundell
6. Luke Ronchi (wk)
7. Doug Bracewell
8. Josh Clarkson
9. Adam Milne
10. Ben Wheeler
11. Hamish Bennett

Southern:

1. Peter Fulton
2. Tom Latham (c)
3. Jimmy Neesham
4. Henry Nicholls
5. Derek de Boorder (wk)
6. Andy Ellis
7. Matt Henry
8. Neil Wagner
9. Kyle Jamieson
10. Josh Finnie
11. Ed Nuttall